Illinois's 12Th Congressional District
The 12th congressional district of Illinois is a congressional district in the southern part of U.S.
This article is missing information about the history of the subject. (March 2015) |
It has been represented by Republican Mike Bost since 2015. With a Cook Partisan Voting Index of R+24, it is the most Republican district in Illinois.
| Illinois's 12th congressional district | |||
|---|---|---|---|
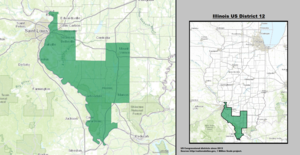
Interactive map of district boundaries since January 3, 2023 | |||
| Representative |
| ||
| Area | 14,296.2 sq mi (37,027 km2) | ||
| Distribution |
| ||
| Population (2022) | 748,293 | ||
| Median household income | $62,253 | ||
| Ethnicity |
| ||
| Cook PVI | R+24 | ||
.svg)
Composition
2011 redistricting
The district covers parts of Madison county, and all of Alexander, Franklin, Jackson, Jefferson, Monroe, Perry, Pulaski, Randolph, St. Clair, Union and Williamson counties, as of the 2011 redistricting which followed the 2010 census. All or parts of Belleville, Cahokia, Carbondale, Collinsville, East St. Louis, Granite City, Herrin, Marion, Mt. Vernon, O'Fallon, Shiloh and Swansea are included. The representatives for these districts were elected in the 2012 primary and general elections, and the boundaries became effective on January 5, 2013.
2021 redistricting
| # | County | Seat | Population |
|---|---|---|---|
| 23 | Clark | Marshall | 15,300 |
| 25 | Clay | Louisville | 13,143 |
| 27 | Clinton | Carlyle | 36,793 |
| 29 | Coles | Charleston | 46,765 |
| 33 | Crawford | Robinson | 18,659 |
| 35 | Cumberland | Toledo | 10,345 |
| 47 | Edwards | Albion | 6,075 |
| 49 | Effingham | Effingham | 34,430 |
| 59 | Gallatin | Shawneetown | 4,903 |
| 65 | Hamilton | McLeansboro | 7,911 |
| 69 | Hardin | Elizabethtown | 3,650 |
| 77 | Jackson | Murphysboro | 52,565 |
| 79 | Jasper | Newton | 9,193 |
| 81 | Jefferson | Mount Vernon | 36,877 |
| 87 | Johnson | Vienna | 13,463 |
| 101 | Lawrence | Lawrenceville | 15,152 |
| 121 | Marion | Salem | 37,390 |
| 125 | Massac | Metropolis | 12,881 |
| 133 | Monroe | Waterloo | 34,932 |
| 145 | Perry | Pinckneyville | 20,985 |
| 151 | Pope | Golconda | 3,779 |
| 153 | Pulaski | Mound City | 5,065 |
| 157 | Randolph | Chester | 30,142 |
| 165 | Saline | Harrisburg | 23,320 |
| 163 | St. Clair | Belleville | 257,400 |
| 181 | Union | Jonesboro | 16,923 |
| 185 | Wabash | Mount Carmel | 11,202 |
| 191 | Wayne | Fairfield | 15,963 |
| 193 | White | Carmi | 13,784 |
| 199 | Williamson | Marion | 66,879 |
Following the 2020 redistricting, this district will go from covering southeastern Illinois to encompassing the entirety of Southern Illinois, spanning the Illinois-Missouri-Kentucky-Indiana border. It will take in Monroe, Randolph, Clinton, Perry, Jackson, Union, Alexander, Pulaski, Massac, Johnson, Williamson, Jefferson, Marion, Clay, Effingham, Wayne, Hamilton, Saline, Pope, Hardin, Gallatin, White, Edwards, Wabash, Richland, Lawrence, Jasper, Crawford, Cumberland, and Clark Counties, most of St. Clair County, and half of Coles County.
St. Clair County is split between this district and the 13th district. They are partitioned by a Conrail line, Tanglewood Parkway, Donner Ridge, Hollywood Heights Rd, Oliver St, CSX Transportation Line, S Oak St, W 5th St, S Lincoln Ave, E US Highway 50, County Rd 218, Old O'Fallon Rd, Frank Scott Parkway E, N Green Mount Rd, S Green Mount Rd, Park Rd, S 59th St, Old St. Louis Rd, Illinois Highway 15, Rolling Acres Ln, Excellence Dr, Powdermill Creek, Cemetery Rd, and Illinois Highway 50. The 12th district takes in the municipalities of Mascoutah, Lebanon, New Athens, Marissa, Millstadt, Smithton, and Freeburg; most of Shiloh; and half of O'Fallon.
Coles County is split between this district and the 15th district. They are partitioned by West St, North County Rd 1800 East, Lincoln Prairie Grass Trail, 18th St, County Rd 1600 East, County Rd 400 North, County Rd 1240 East, Illinois Route 16, Dettro Dr, 700 North Rd, Old Fellow Rd, and the Kickapoo Creek. The 12th district takes in the municipalities of Ashmore, Oakland, and Lerna; part of southern Mattoon; and part of Charleston.
Presidential election results
- This table indicates how the district has voted in U.S. presidential elections; election results reflect voting in the district as it was configured at the time of the election, not as it is configured today.
| Year | Office | Results |
|---|---|---|
| 2000 | President | Al Gore 53% – George W. Bush 44% |
| 2004 | President | John Kerry 52% – George W. Bush 48% |
| 2008 | President | Barack Obama 55% – John McCain 44% |
| 2012 | President | Barack Obama 50% – Mitt Romney 48% |
| 2016 | President | Donald Trump 55% – Hillary Clinton 40% |
| 2020 | President | Donald Trump 56% – Joe Biden 41% |
Recent election results from statewide races
- This table indicates how the district has voted in recent statewide elections; election results reflect voting in the district as it is currently configured, not necessarily as it was at the time of these elections.
| Year | Office | Results |
|---|---|---|
| 2016 | President | Donald Trump 68.5% – Hillary Clinton 26.0% |
| Senate | Mark Kirk 55.9% – Tammy Duckworth 39.2% | |
| 2018 | Governor | Bruce Rauner 57.0% – J. B. Pritzker 33.4% |
| Attorney General | Erika Harold 66.7% – Kwame Raoul 30.2% | |
| Secretary of State | Jason Helland 50.8% – Jesse White 47.1% | |
| 2020 | President | Donald Trump 70.5% – Joe Biden 27.7% |
| Senate | Mark Curran 66.5% – Dick Durbin 30.9% | |
| 2022 | Senate | Kathy Salvi 67.9% – Tammy Duckworth 30.3% |
| Governor | Darren Bailey 72.4% – J. B. Pritzker 25.2% | |
| Attorney General | Tom Devore 72.0% – Kwame Raoul 25.6% | |
| Secretary of State | Dan Brady 72.0% – Alexi Giannoulias 25.8% |
List of members representing the district


.jpg)
.jpg)


.jpg)


_(new_version).svg)
Elections
This section needs expansion. You can help by adding to it. (March 2015) |
2012
| Party | Candidate | Votes | % | |
|---|---|---|---|---|
| Democratic | William Enyart | 157,000 | 51.7 | |
| Republican | Jason Plummer | 129,902 | 42.7 | |
| Green | Paula Bradshaw | 17,045 | 5.6 | |
| Write-in | Shon-Tiyon Horton | 2 | 0.0 | |
| Total votes | 303,947 | 100 | ||
2014
| Party | Candidate | Votes | % | |
|---|---|---|---|---|
| Republican | Mike Bost | 110,038 | 52.5 | |
| Democratic | William Enyart (incumbent) | 87,860 | 41.9 | |
| Green | Paula Bradshaw | 11,840 | 5.6 | |
| Total votes | 209,738 | 100.0 | ||
| Republican gain from Democratic | ||||
2016
| Party | Candidate | Votes | % | |
|---|---|---|---|---|
| Republican | Mike Bost (incumbent) | 169,976 | 54.3 | |
| Democratic | C.J. Baricevic | 124,246 | 39.7 | |
| Green | Paula Bradshaw | 18,780 | 6.0 | |
| Total votes | 313,002 | 100.0 | ||
| Republican hold | ||||
2018
| Party | Candidate | Votes | % | |
|---|---|---|---|---|
| Republican | Mike Bost (incumbent) | 134,884 | 51.6 | |
| Democratic | Brendan Kelly | 118,724 | 45.4 | |
| Green | Randall Auxier | 7,935 | 3.0 | |
| Total votes | 261,543 | 100.0 | ||
| Republican hold | ||||
2020
| Party | Candidate | Votes | % | ±% | |
|---|---|---|---|---|---|
| Republican | Mike Bost (incumbent) | 194,839 | 60.43 | +8.86% | |
| Democratic | Raymond Lenzi | 127,577 | 39.57 | -5.82% | |
| Total votes | 322,416 | 100.0 | |||
| Republican hold | |||||
2022
| Party | Candidate | Votes | % | |
|---|---|---|---|---|
| Republican | Mike Bost (incumbent) | 218,379 | 75.00 | |
| Democratic | Chip Markel | 72,791 | 25.00 | |
| Write-in | 1 | 0.00 | ||
| Total votes | 291,171 | 100.0 | ||
| Republican hold | ||||
See also


References
Sources
- Martis, Kenneth C. (1989). The Historical Atlas of Political Parties in the United States Congress. New York: Macmillan Publishing Company.
- Martis, Kenneth C. (1982). The Historical Atlas of United States Congressional Districts. New York: Macmillan Publishing Company.
- Congressional Biographical Directory of the United States 1774–present, bioguide.congress.gov; accessed November 10, 2016.
External links
This article uses material from the Wikipedia English article Illinois's 12th congressional district, which is released under the Creative Commons Attribution-ShareAlike 3.0 license ("CC BY-SA 3.0"); additional terms may apply (view authors). Content is available under CC BY-SA 4.0 unless otherwise noted. Images, videos and audio are available under their respective licenses.
®Wikipedia is a registered trademark of the Wiki Foundation, Inc. Wiki English (DUHOCTRUNGQUOC.VN) is an independent company and has no affiliation with Wiki Foundation.