Union County, Illinois
Union County is a county located in the U.S.
state">U.S. state of Illinois. According to the 2020 United States Census, it had a population of 17,244. Its county seat is Jonesboro. It is located in the southern portion of Illinois known locally as "Little Egypt".
Union County | |
|---|---|
 Union County Courthouse in Jonesboro | |
 Location within the U.S. state of Illinois | |
 Illinois's location within the U.S. | |
| Coordinates: 37°28′N 89°16′W / 37.47°N 89.26°W | |
| Country | |
| State | |
| Founded | January 2, 1818 |
| Seat | Jonesboro |
| Largest city | Anna |
| Area | |
| • Total | 422 sq mi (1,090 km2) |
| • Land | 413 sq mi (1,070 km2) |
| • Water | 8.7 sq mi (23 km2) 2.1% |
| Population (2020) | |
| • Total | 17,244 |
| • Density | 41/sq mi (16/km2) |
| Time zone | UTC−6 (Central) |
| • Summer (DST) | UTC−5 (CDT) |
| Congressional district | 12th |
| Website | www |
History
Union County was formed out of Johnson County, nearly a year before the Illinois Territory gained statehood. It was named for a joint revival meeting of the Baptists and Dunkards, called a "union meeting". The county seal depicts the leaders of these two groups shaking hands.
-
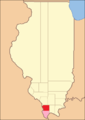 For its first year of existence, Union County included an area of unorganized territory temporarily attached to it.
 -
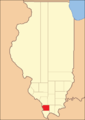 In 1819, the additional territory became Alexander County, reducing Union to its current borders.


Geography
According to the US Census Bureau, the county has a total area of 422 square miles (1,090 km2), of which 413 square miles (1,070 km2) is land and 8.7 square miles (23 km2) (2.1%) is water.
Climate and weather
| Jonesboro, Illinois | ||||||||||||||||||||||||||||||||||||||||||||||||||||||||||||
|---|---|---|---|---|---|---|---|---|---|---|---|---|---|---|---|---|---|---|---|---|---|---|---|---|---|---|---|---|---|---|---|---|---|---|---|---|---|---|---|---|---|---|---|---|---|---|---|---|---|---|---|---|---|---|---|---|---|---|---|---|
| Climate chart (explanation) | ||||||||||||||||||||||||||||||||||||||||||||||||||||||||||||
| ||||||||||||||||||||||||||||||||||||||||||||||||||||||||||||
| ||||||||||||||||||||||||||||||||||||||||||||||||||||||||||||
In recent years, average temperatures in the county seat of Jonesboro have ranged from a low of 22 °F (−6 °C) in January to a high of 90 °F (32 °C) in July, although a record low of −20 °F (−29 °C) was recorded in January 1918 and a record high of 112 °F (44 °C) was recorded in July 1901. Average monthly precipitation ranged from 3.13 inches (80 mm) in September to 5.22 inches (133 mm) in May.
Major highways


Adjacent counties
- Jackson County – north
- Williamson County – northeast
- Johnson County – east
- Pulaski County – southeast
- Alexander County – south
- Cape Girardeau County, Missouri – west
- Perry County, Missouri – northwest
Protected areas
- Brown Barrens Nature Preserve
- Crab Orchard National Wildlife Refuge (partial)
- Cypress Creek National Wildlife Refuge (partial)
- Lincoln Memorial Picnic Grounds
- Giant City State Park (partial)
- McClure Shale Glade Nature Preserve
- Trail of Tears State Forest
- Shawnee National Forest (partial)
- Union County State Fish and Wildlife Area
Demographics
| Census | Pop. | Note | %± |
|---|---|---|---|
| 1820 | 2,362 | — | |
| 1830 | 3,239 | 37.1% | |
| 1840 | 5,524 | 70.5% | |
| 1850 | 7,615 | 37.9% | |
| 1860 | 11,181 | 46.8% | |
| 1870 | 16,518 | 47.7% | |
| 1880 | 18,102 | 9.6% | |
| 1890 | 21,549 | 19.0% | |
| 1900 | 22,610 | 4.9% | |
| 1910 | 21,856 | −3.3% | |
| 1920 | 20,249 | −7.4% | |
| 1930 | 19,883 | −1.8% | |
| 1940 | 21,528 | 8.3% | |
| 1950 | 20,500 | −4.8% | |
| 1960 | 17,645 | −13.9% | |
| 1970 | 16,071 | −8.9% | |
| 1980 | 17,765 | 10.5% | |
| 1990 | 17,619 | −0.8% | |
| 2000 | 18,293 | 3.8% | |
| 2010 | 17,808 | −2.7% | |
| 2020 | 17,244 | −3.2% | |
| 2023 (est.) | 16,667 | −3.3% | |
| US Decennial Census 1790-1960 1900-1990 1990-2000 2010-2013 2020 | |||
As of the 2010 United States Census, there were 17,808 people, 7,167 households, and 4,837 families residing in the county. The population density was 43.1 inhabitants per square mile (16.6/km2). There were 7,924 housing units at an average density of 19.2 per square mile (7.4/km2). The racial makeup of the county was 94.8% white, 0.9% black or African American, 0.5% American Indian, 0.3% Asian, 2.0% from other races, and 1.5% from two or more races. Those of Hispanic or Latino origin made up 4.8% of the population. In terms of ancestry, 23.0% were German, 12.6% were Irish, 9.4% were English, and 8.1% were American.
Of the 7,167 households, 29.7% had children under the age of 18 living with them, 52.6% were married couples living together, 10.6% had a female householder with no husband present, 32.5% were non-families, and 28.4% of all households were made up of individuals. The average household size was 2.41 and the average family size was 2.92. The median age was 42.9 years.
The median income for a household in the county was $39,760 and the median income for a family was $48,465. Males had a median income of $36,831 versus $31,272 for females. The per capita income for the county was $19,512. About 12.7% of families and 21.1% of the population were below the poverty line, including 22.5% of those under age 18 and 16.7% of those age 65 or over.
Communities
Cities
Villages
Unincorporated communities
Politics
Like much of Southern Illinois, Union County has shifted toward the Republican Party over the past couple decades, with the Republican candidate for president winning the county since 2000.
| Year | Republican | Democratic | Third party | |||
|---|---|---|---|---|---|---|
| No. | % | No. | % | No. | % | |
| 2020 | 6,161 | 69.19% | 2,579 | 28.96% | 164 | 1.84% |
| 2016 | 5,790 | 67.20% | 2,402 | 27.88% | 424 | 4.92% |
| 2012 | 4,957 | 59.59% | 3,137 | 37.71% | 224 | 2.69% |
| 2008 | 5,003 | 54.65% | 3,918 | 42.80% | 233 | 2.55% |
| 2004 | 5,333 | 58.48% | 3,735 | 40.96% | 51 | 0.56% |
| 2000 | 4,397 | 50.77% | 3,982 | 45.98% | 281 | 3.24% |
| 1996 | 3,147 | 38.00% | 4,252 | 51.34% | 883 | 10.66% |
| 1992 | 3,003 | 33.06% | 4,681 | 51.54% | 1,399 | 15.40% |
| 1988 | 4,244 | 50.05% | 4,197 | 49.50% | 38 | 0.45% |
| 1984 | 4,721 | 55.13% | 3,815 | 44.55% | 28 | 0.33% |
| 1980 | 4,289 | 50.81% | 3,781 | 44.79% | 371 | 4.40% |
| 1976 | 3,531 | 41.16% | 5,003 | 58.32% | 44 | 0.51% |
| 1972 | 5,034 | 59.36% | 3,428 | 40.42% | 18 | 0.21% |
| 1968 | 3,889 | 46.45% | 3,603 | 43.04% | 880 | 10.51% |
| 1964 | 3,142 | 37.63% | 5,208 | 62.37% | 0 | 0.00% |
| 1960 | 4,432 | 50.58% | 4,321 | 49.31% | 10 | 0.11% |
| 1956 | 4,204 | 49.06% | 4,359 | 50.87% | 6 | 0.07% |
| 1952 | 4,658 | 51.97% | 4,296 | 47.93% | 9 | 0.10% |
| 1948 | 3,864 | 46.01% | 4,479 | 53.33% | 55 | 0.65% |
| 1944 | 4,114 | 48.25% | 4,367 | 51.21% | 46 | 0.54% |
| 1940 | 4,915 | 45.51% | 5,804 | 53.74% | 81 | 0.75% |
| 1936 | 4,165 | 39.81% | 6,260 | 59.84% | 36 | 0.34% |
| 1932 | 2,859 | 31.47% | 6,157 | 67.77% | 69 | 0.76% |
| 1928 | 3,352 | 44.52% | 4,149 | 55.10% | 29 | 0.39% |
| 1924 | 2,579 | 39.16% | 3,783 | 57.44% | 224 | 3.40% |
| 1920 | 3,119 | 45.55% | 3,660 | 53.45% | 68 | 0.99% |
| 1916 | 3,135 | 37.11% | 5,171 | 61.22% | 141 | 1.67% |
| 1912 | 458 | 10.44% | 2,648 | 60.36% | 1,281 | 29.20% |
| 1908 | 1,695 | 37.43% | 2,690 | 59.40% | 144 | 3.18% |
| 1904 | 1,537 | 39.54% | 1,967 | 50.60% | 383 | 9.85% |
| 1900 | 1,695 | 36.49% | 2,900 | 62.43% | 50 | 1.08% |
| 1896 | 1,842 | 37.65% | 2,998 | 61.28% | 52 | 1.06% |
| 1892 | 1,427 | 33.96% | 2,663 | 63.37% | 112 | 2.67% |
Education
School districts include:
K-12:
- Cobden School Unit District 17
- Dongola School Unit District 66
- Goreville Community Unit School District 1
- Shawnee Community Unit School District 84
Secondary:
- Anna Jonesboro Community High School District 81
- Vienna High School District 133
Elementary:
- Anna Community Consolidated School District 37
- Buncombe Consolidated School District 43
- Cypress School District 64
- Jonesboro Community Consolidated School District 43
- Lick Creek Community Consolidated School District 16
See also
References
This article uses material from the Wikipedia English article Union County, Illinois, which is released under the Creative Commons Attribution-ShareAlike 3.0 license ("CC BY-SA 3.0"); additional terms may apply (view authors). Content is available under CC BY-SA 4.0 unless otherwise noted. Images, videos and audio are available under their respective licenses.
®Wikipedia is a registered trademark of the Wiki Foundation, Inc. Wiki English (DUHOCTRUNGQUOC.VN) is an independent company and has no affiliation with Wiki Foundation.