House Of Representatives Results Of The 2016 Australian Federal Election
The following tables show state-by-state results in the Australian House of Representatives at the 2016 federal election, Coalition 76, Labor 69, Australian Greens 1, Nick Xenophon Team 1, Katter's Australian Party 1, with 2 independents.
| ||||||||||||||||||||||||||||||||||||||||||||||||||||||||||||||||
All 150 seats in the Australian House of Representatives 76 seats needed for a majority | ||||||||||||||||||||||||||||||||||||||||||||||||||||||||||||||||
| Turnout | 91.0% | |||||||||||||||||||||||||||||||||||||||||||||||||||||||||||||||
|---|---|---|---|---|---|---|---|---|---|---|---|---|---|---|---|---|---|---|---|---|---|---|---|---|---|---|---|---|---|---|---|---|---|---|---|---|---|---|---|---|---|---|---|---|---|---|---|---|---|---|---|---|---|---|---|---|---|---|---|---|---|---|---|---|
This lists parties that won seats. See the complete results below.
| ||||||||||||||||||||||||||||||||||||||||||||||||||||||||||||||||
.jpg)
A number of initially-elected senators were declared ineligible a result of the 2017–18 Australian parliamentary eligibility crisis, and replaced after recounts.
Australia


Coalition
Liberal (45)
LNP (21)
National (10)
Opposition (69)
Labor (69)
Crossbench (5)
Greens (1)
Xenophon (1)
Katter (1)
Independent (2)
| Party | Votes | % | Swing | Seats | Change | ||
|---|---|---|---|---|---|---|---|
| Australian Labor Party | 4,702,296 | 34.73 | +1.35 | 69 |  14 14 | ||
| Coalition | |||||||
| Liberal Party of Australia | 3,882,905 | 28.67 | −3.35 | 45 |  13 13 | ||
| Liberal National Party (QLD) | 1,153,736 | 8.52 | −0.40 | 21 | 1 | ||
| National Party of Australia | 624,555 | 4.61 | +0.32 | 10 | 1 | ||
| Country Liberal Party (NT) | 32,409 | 0.24 | −0.08 | 0 | 1 | ||
| Australian Greens | 1,385,650 | 10.23 | +1.58 | 1 |  | ||
| Nick Xenophon Team | 250,333 | 1.85 | +1.85 | 1 | 1 | ||
| Family First Party | 201,222 | 1.49 | +0.08 | ||||
| Christian Democratic Party | 178,026 | 1.31 | +0.62 | ||||
| Pauline Hanson's One Nation | 175,020 | 1.29 | +1.12 | ||||
| Animal Justice Party | 94,516 | 0.70 | +0.69 | ||||
| Katter's Australian Party | 72,879 | 0.54 | −0.50 | 1 | | ||
| Rise Up Australia Party | 68,418 | 0.51 | +0.13 | ||||
| Liberal Democratic Party | 66,261 | 0.49 | +0.45 | ||||
| Australian Christians | 43,150 | 0.32 | −0.01 | ||||
| Australian Liberty Alliance | 25,337 | 0.19 | +0.19 | ||||
| Drug Law Reform Australia | 20,350 | 0.15 | +0.15 | ||||
| Derryn Hinch's Justice Party | 16,885 | 0.12 | +0.12 | ||||
| Shooters, Fishers and Farmers Party | 15,477 | 0.11 | +0.11 | ||||
| Science Party | 14,988 | 0.11 | +0.10 | ||||
| Bullet Train for Australia | 14,078 | 0.10 | −0.05 | ||||
| Australian Sex Party | 12,683 | 0.09 | −0.52 | ||||
| Australian Recreational Fishers Party | 11,254 | 0.08 | +0.08 | ||||
| Glenn Lazarus Team | 10,094 | 0.07 | +0.07 | ||||
| Renewable Energy Party | 8,642 | 0.06 | +0.06 | ||||
| Online Direct Democracy | 8,511 | 0.06 | +0.06 | ||||
| Australian Country Party | 7,033 | 0.05 | +0.01 | ||||
| Australia First Party | 6,895 | 0.05 | −0.01 | ||||
| Arts Party | 6,821 | 0.05 | +0.05 | ||||
| Mature Australia Party | 5,888 | 0.04 | +0.04 | ||||
| Citizens Electoral Council | 5,175 | 0.04 | −0.04 | ||||
| Australian Defence Veterans Party | 4,360 | 0.03 | +0.03 | ||||
| Non-Custodial Parents Party | 3,663 | 0.03 | +0.02 | ||||
| Socialist Alliance | 3,653 | 0.03 | −0.01 | ||||
| CountryMinded | 3,478 | 0.03 | +0.03 | ||||
| Australian Equality Party (Marriage) | 3,296 | 0.02 | +0.02 | ||||
| Democratic Labour Party | 3,166 | 0.02 | −0.26 | ||||
| Outdoor Recreation Party (Stop The Greens) | 2,375 | 0.02 | +0.02 | ||||
| Consumer Rights & No-Tolls | 2,050 | 0.02 | +0.02 | ||||
| Socialist Equality Party | 1,608 | 0.01 | +0.01 | ||||
| Australian Antipaedophile Party | 1,527 | 0.01 | +0.01 | ||||
| Smokers' Rights Party | 1,343 | 0.01 | +0.01 | ||||
| Pirate Party Australia | 1,260 | 0.01 | +0.01 | ||||
| HEMP Party | 1,143 | 0.01 | +0.01 | ||||
| Voluntary Euthanasia Party | 973 | 0.01 | +0.01 | ||||
| Australian Cyclists Party | 846 | 0.01 | +0.01 | ||||
| Sustainable Australia | 606 | 0.00 | −0.03 | ||||
| Palmer United Party | 315 | 0.00 | −5.49 | 0 | 1 | ||
| Australian Progressives | 282 | 0.00 | +0.00 | ||||
| Independents | 380,712 | 2.81 | +1.44 | 2 | | ||
| Non Affiliated | 2,958 | 0.02 | −0.02 | ||||
| Total | 13,541,101 | 150 | |||||
| Two-party-preferred vote | |||||||
| Liberal/National Coalition | 6,818,824 | 50.36 | −3.13 | 76 | 14 | ||
| Australian Labor Party | 6,722,277 | 49.64 | +3.13 | 69 | 14 | ||
| Invalid/blank votes | 131,722 | 4.70 | −0.86 | ||||
| Total votes | 14,262,016 | ||||||
| Registered voters/turnout | 15,671,551 | 91.01 | –2.22 | ||||
| Source: Federal Election 2016 | |||||||

New South Wales
 | ||||||||||||||||||||||||||||||||||
All 47 New South Wales seats in the Australian House of Representatives and all 12 seats in the Australian Senate | ||||||||||||||||||||||||||||||||||
|---|---|---|---|---|---|---|---|---|---|---|---|---|---|---|---|---|---|---|---|---|---|---|---|---|---|---|---|---|---|---|---|---|---|---|
| ||||||||||||||||||||||||||||||||||
  | ||||||||||||||||||||||||||||||||||

Liberal to Labor: Barton, Dobell, Eden-Monaro, Lindsay, Macarthur, Macquarie, Paterson
Victoria
 | |||||||||||||||||||||||||||||||||||||||||||||
All 37 Victorian seats in the Australian House of Representatives and all 12 seats in the Australian Senate | |||||||||||||||||||||||||||||||||||||||||||||
|---|---|---|---|---|---|---|---|---|---|---|---|---|---|---|---|---|---|---|---|---|---|---|---|---|---|---|---|---|---|---|---|---|---|---|---|---|---|---|---|---|---|---|---|---|---|
| |||||||||||||||||||||||||||||||||||||||||||||
  | |||||||||||||||||||||||||||||||||||||||||||||

Labor to Liberal: Chisholm
Liberal to National: Murray
Queensland
 | |||||||||||||||||||||||||||||||||||||||||||||||||||||
All 30 Queensland seats in the Australian House of Representatives and all 12 seats in the Australian Senate | |||||||||||||||||||||||||||||||||||||||||||||||||||||
|---|---|---|---|---|---|---|---|---|---|---|---|---|---|---|---|---|---|---|---|---|---|---|---|---|---|---|---|---|---|---|---|---|---|---|---|---|---|---|---|---|---|---|---|---|---|---|---|---|---|---|---|---|---|
| |||||||||||||||||||||||||||||||||||||||||||||||||||||
,_2016.png) ,_2016.png) | |||||||||||||||||||||||||||||||||||||||||||||||||||||

| Party | Votes | % | Swing | Seats | Change | |
|---|---|---|---|---|---|---|
| Liberal National Party | 1,153,736 | 43.19 | –2.47 | 21 | 1 | |
| Australian Labor Party | 825,627 | 30.91 | +1.14 | 8 | 2 | |
| Australian Greens | 235,887 | 8.83 | +2.61 | |||
| Pauline Hanson's One Nation | 147,478 | 5.52 | +5.42 | |||
| Family First Party | 103,933 | 3.89 | +1.85 | |||
| Katter's Australian Party | 72,879 | 2.73 | –1.02 | 1 | 0 | |
| Liberal Democratic Party | 25,665 | 0.96 | +0.96 | |||
| Australian Liberty Alliance | 12,320 | 0.46 | +0.46 | |||
| Nick Xenophon Team | 11,032 | 0.41 | +0.41 | |||
| Glenn Lazarus Team | 10,094 | 0.38 | +0.38 | |||
| Rise Up Australia Party | 4,490 | 0.17 | –0.22 | |||
| Drug Law Reform Australia | 4,466 | 0.17 | +0.17 | |||
| Australian Defence Veterans Party | 2,912 | 0.11 | +0.11 | |||
| CountryMinded | 2,141 | 0.08 | +0.08 | |||
| Consumer Rights & No-Tolls | 2,050 | 0.08 | +0.08 | |||
| Democratic Labour Party | 1,566 | 0.06 | +0.02 | |||
| The Arts Party | 1,467 | 0.05 | +0.05 | |||
| Online Direct Democracy | 1,062 | 0.04 | +0.04 | |||
| Mature Australia Party | 902 | 0.03 | +0.02 | |||
| Palmer United Party | 315 | 0.01 | −11.01 | 0 | 1 | |
| Independent | 50,377 | 1.89 | +1.51 | |||
| Non Affiliated | 830 | 0.03 | −0.12 | |||
| Total | 2,671,229 | 30 | ||||
| Two-party-preferred vote | ||||||
| Liberal National Party | 1,445,030 | 54.10 | −2.88 | 21 | 1 | |
| Australian Labor Party | 1,226,199 | 45.90 | +2.88 | 8 | 2 | |
Liberal National to Labor: Herbert, Longman
Palmer to Liberal National: Fairfax
Western Australia
 | ||||||||||||||||||||||||||||||||||
All 16 Western Australian seats in the Australian House of Representatives and all 12 seats in the Australian Senate | ||||||||||||||||||||||||||||||||||
|---|---|---|---|---|---|---|---|---|---|---|---|---|---|---|---|---|---|---|---|---|---|---|---|---|---|---|---|---|---|---|---|---|---|---|
| ||||||||||||||||||||||||||||||||||
  | ||||||||||||||||||||||||||||||||||
| Party | Votes | % | Swing | Seats | Change | |
|---|---|---|---|---|---|---|
| Liberal Party of Australia | 611,605 | 45.70 | –1.61 | 11 | 1 | |
| Australian Labor Party | 434,318 | 32.45 | +3.69 | 5 | 2 | |
| Australian Greens | 161,443 | 12.06 | +2.32 | |||
| National Party of Australia | 40,160 | 3.00 | −0.90 | |||
| Australian Christians | 34,197 | 2.56 | +0.53 | |||
| Rise Up Australia Party | 20,859 | 1.56 | +0.84 | |||
| Shooters, Fishers and Farmers Party | 6,022 | 0.45 | +0.45 | |||
| Mature Australia Party | 3,203 | 0.24 | +0.24 | |||
| Liberal Democratic Party | 2,526 | 0.19 | +0.19 | |||
| Outdoor Recreation Party | 2,375 | 0.18 | +0.18 | |||
| Australian Liberty Alliance | 1,544 | 0.10 | +0.10 | |||
| Socialist Alliance | 1,404 | 0.10 | +0.04 | |||
| Online Direct Democracy | 1,300 | 0.10 | +0.10 | |||
| Independent | 17,381 | 1.30 | +1.03 | |||
| Total | 1,338,337 | 16 | ||||
| Two-party-preferred vote | ||||||
| Liberal Party of Australia | 731,497 | 54.66 | −3.62 | 11 | 1 | |
| Australian Labor Party | 606,840 | 45.34 | +3.62 | 5 | 2 | |
South Australia
 | |||||||||||||||||||||||||||||||||||||||||||||||||
All 11 South Australian seats in the Australian House of Representatives and all 12 seats in the Australian Senate | |||||||||||||||||||||||||||||||||||||||||||||||||
|---|---|---|---|---|---|---|---|---|---|---|---|---|---|---|---|---|---|---|---|---|---|---|---|---|---|---|---|---|---|---|---|---|---|---|---|---|---|---|---|---|---|---|---|---|---|---|---|---|---|
| |||||||||||||||||||||||||||||||||||||||||||||||||
  | |||||||||||||||||||||||||||||||||||||||||||||||||

| Party | Votes | % | Swing | Seats | Change | |
|---|---|---|---|---|---|---|
| Liberal Party of Australia | 365,155 | 35.09 | –9.40 | 4 | 2 | |
| Australian Labor Party | 328,314 | 31.55 | –4.18 | 6 | 1 | |
| Nick Xenophon Team | 221,210 | 21.26 | +21.26 | 1 | 1 | |
| Australian Greens | 64,605 | 6.21 | −2.07 | |||
| Family First Party | 40,941 | 3.93 | −1.48 | |||
| Animal Justice Party | 8,881 | 0.85 | +0.85 | |||
| Liberal Democratic Party | 2,178 | 0.21 | +0.21 | |||
| Christian Democratic Party | 1,715 | 0.16 | +0.16 | |||
| Independent | 7,737 | 0.74 | −0.54 | |||
| Total | 1,040,736 | 11 | ||||
| Two-party-preferred vote | ||||||
| Australian Labor Party | 544,017 | 52.27 | +4.63 | 6 | 1 | |
| Liberal Party of Australia | 496,719 | 47.73 | −4.63 | 4 | 2 | |
Liberal to Labor: Hindmarsh
Liberal to Xenophon: Mayo
Tasmania
 | ||||||||||||||||||||||||||||||||||
All 5 Tasmanian seats in the Australian House of Representatives and all 12 seats in the Australian Senate | ||||||||||||||||||||||||||||||||||
|---|---|---|---|---|---|---|---|---|---|---|---|---|---|---|---|---|---|---|---|---|---|---|---|---|---|---|---|---|---|---|---|---|---|---|
| ||||||||||||||||||||||||||||||||||
 | ||||||||||||||||||||||||||||||||||
This is a list of electoral division results for the 2016 Australian federal election in the state of Tasmania.
| Party | Votes | % | Swing | Seats | Change | |||
|---|---|---|---|---|---|---|---|---|
| Australian Labor Party | 127,186 | 37.90 | +3.09 | 4 | 3 | |||
| Liberal Party of Australia | 118,956 | 35.44 | –4.82 | 0 | 3 | |||
| Australian Greens | 34,291 | 10.22 | +1.90 | |||||
| Australian Recreational Fishers Party | 11,254 | 3.35 | +3.35 | |||||
| Christian Democratic Party | 6,345 | 1.89 | +1.89 | |||||
| Renewable Energy Party | 4,534 | 1.35 | +1.35 | |||||
| The Arts Party | 1,673 | 0.50 | +0.50 | |||||
| Liberal Democratic Party | 1,380 | 0.41 | +0.41 | |||||
| Democratic Labour Party | 632 | 0.19 | +0.02 | |||||
| Independent | 29,372 | 8.75 | +1.28 | 1 | | |||
| Total | 335,623 | 5 | ||||||
| Two-party-preferred vote | ||||||||
| Australian Labor Party | 192,530 | 57.36 | +6.13 | 4 | 3 | |||
| Liberal Party of Australia | 143,093 | 42.64 | −6.13 | 0 | 3 | |||
Territories
Australian Capital Territory
 | ||||||||||||||||||||||||||||
All 2 Australian Capital Territory seats in the Australian House of Representatives and all 2 seats in the Australian Senate | ||||||||||||||||||||||||||||
|---|---|---|---|---|---|---|---|---|---|---|---|---|---|---|---|---|---|---|---|---|---|---|---|---|---|---|---|---|
| ||||||||||||||||||||||||||||
 | ||||||||||||||||||||||||||||
| Party | Votes | % | Swing | Seats | Change | |
|---|---|---|---|---|---|---|
| Australian Labor Party | 111,887 | 44.27 | +1.34 | 2 | | |
| Liberal Party of Australia | 87,346 | 34.56 | –0.06 | 0 | | |
| Australian Greens | 38,129 | 15.09 | +1.69 | |||
| Bullet Train for Australia | 10,673 | 4.22 | +0.14 | |||
| Independent | 4,707 | 1.86 | +1.86 | |||
| Total | 252,742 | 2 | ||||
| Two-party-preferred vote | ||||||
| Australian Labor Party | 154,489 | 61.13 | +1.22 | 2 | 0 | |
| Liberal Party of Australia | 98,253 | 38.87 | −1.22 | 0 | 0 | |
Northern Territory
 | ||||||||||||||||||||||||||||
All 2 Northern Territory seats in the Australian House of Representatives and all 2 seats in the Australian Senate | ||||||||||||||||||||||||||||
|---|---|---|---|---|---|---|---|---|---|---|---|---|---|---|---|---|---|---|---|---|---|---|---|---|---|---|---|---|
| ||||||||||||||||||||||||||||
 | ||||||||||||||||||||||||||||
| Party | Votes | % | Swing | Seats | Change | |
|---|---|---|---|---|---|---|
| Australian Labor Party | 39,364 | 40.39 | +2.96 | 2 | 1 | |
| Country Liberal Party | 32,409 | 33.25 | –8.45 | 0 | 1 | |
| Australian Greens | 8,858 | 9.09 | +1.20 | |||
| Shooters, Fishers and Farmers Party | 4,584 | 4.70 | +4.70 | |||
| Rise Up Australia Party | 2,483 | 2.55 | +1.10 | |||
| Liberal Democratic Party | 1,275 | 1.31 | +1.31 | |||
| Help End Marijuana Prohibition (HEMP) Party | 1,143 | 1.17 | +1.17 | |||
| Australia First Party | 798 | 0.82 | +0.82 | |||
| Citizens Electoral Council | 444 | 0.46 | −1.41 | |||
| Online Direct Democracy | 369 | 0.38 | +0.38 | |||
| Independent | 5,733 | 5.88 | +5.13 | |||
| Total | 97,460 | 2 | ||||
| Two-party-preferred vote | ||||||
| Australian Labor Party | 55,614 | 57.06 | +7.41 | 2 | 1 | |
| Country Liberal Party | 41,846 | 42.94 | −7.41 | 0 | 1 | |
Country Liberal to Labor: Solomon
Two party preferred preference flow
| Party | Liberal National coalition | Labor Party | |||||||
|---|---|---|---|---|---|---|---|---|---|
| Votes | % | ± | Votes | % | ± | ||||
| Greens | 250,263 | 18.06% | +1.09 | 1,135,387 | 81.94% | –1.09 | |||
| One Nation | 88,327 | 50.47% | –4.63 | 86,693 | 49.53% | +4.63 | |||
| United Australia Party | 117 | 37.14% | –16.53 | 198 | 62.86% | +16.53 | |||
| Liberal Democratic Party | 46,458 | 70.11% | –9.45 | 19,803 | 29.89% | +9.45 | |||
| Christian Democratic Party | 129,463 | 72.72% | +1.21 | 48,563 | 27.28% | –1.21 | |||
| Democratic Labour Party | 1,132 | 35.75% | –7.76 | 2,034 | 64.25% | +7.76 | |||
| Rise Up Australia Party | 36,239 | 52.97% | –7.26 | 32,179 | 47.03% | +7.26 | |||
| Australia First Party | 3,161 | 45.84% | –13.89 | 3,734 | 54.16% | +13.89 | |||
| Animal Justice Party | 35,204 | 37.25% | +5.62 | 59,312 | 62.75% | –5.62 | |||
| Australian Federation Party | |||||||||
| Katter's Australian | 38,656 | 53.04% | –0.96 | 34,223 | 46.96% | +0.96 | |||
| Centre Alliance | 99,564 | 39.77% | – | 150,769 | 60.23% | – | |||
| Australian Christians | 31,186 | 72.27% | +2.22 | 11,964 | 27.73% | –2.22 | |||
| Australian Liberty Alliance | 17,294 | 68.26% | – | 8,043 | 31.74% | – | |||
| Shooters, Fishers and Farmers Party | 7,090 | 45.81% | – | 8,387 | 54.19% | – | |||
| Socialist Alliance | 948 | 25.95% | +6.95 | 2,705 | 74.05% | –6.95 | |||
| Derryn Hinch's Justice Party | 8,276 | 49.01% | – | 8,609 | 50.99% | – | |||
| Australian Citizens Party | 2,715 | 52.46% | +3.08 | 2,460 | 47.54% | –3.08 | |||
| Sustainable Australia | 312 | 51.49% | – | 294 | 48.51% | – | |||
| Reason Party | 2,776 | 31.21% | – | 6,119 | 68.79% | – | |||
| Independents | 194,826 | 40.60% | –2.30 | 285,010 | 59.40% | +2.30 | |||
| Total | 14,659,042 | 100.00 | 151 | | |||||
| Two-party-preferred vote | |||||||||
| Liberal/National Coalition | 6,818,824 | 50.36% | −3.13 | ||||||
| Labor | 6,722,277 | 49.64% | +3.13 | ||||||
| Invalid/blank votes | 802,376 | 5.19% | –0.35 | – | – | – | |||
| Turnout | 15,461,418 | 89.82% | –2.07 | – | – | – | |||
| Registered voters | 17,213,433 | – | – | – | – | – | |||
| Source: AEC for both votes | |||||||||
Maps
Results by electoral division
-
 First preference vote
 -
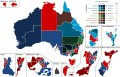 Two-candidate-preferred vote
Results by state and territory
-
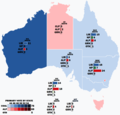 First preference vote and seat totals

See also
References
This article uses material from the Wikipedia English article Results of the 2016 Australian federal election (House of Representatives), which is released under the Creative Commons Attribution-ShareAlike 3.0 license ("CC BY-SA 3.0"); additional terms may apply (view authors). Content is available under CC BY-SA 4.0 unless otherwise noted. Images, videos and audio are available under their respective licenses.
®Wikipedia is a registered trademark of the Wiki Foundation, Inc. Wiki English (DUHOCTRUNGQUOC.VN) is an independent company and has no affiliation with Wiki Foundation.