Pourbaix Diagram
In electrochemistry, and more generally in solution chemistry, a Pourbaix diagram, also known as a potential/pH diagram, EH–pH diagram or a pE/pH diagram, is a plot of possible thermodynamically stable phases (i.e., at chemical equilibrium) of an aqueous electrochemical system.
Boundaries (50 %/50 %) between the predominant chemical species (aqueous ions in solution, or solid phases) are represented by lines. As such a Pourbaix diagram can be read much like a standard phase diagram with a different set of axes. Similarly to phase diagrams, they do not allow for reaction rate or kinetic effects. Beside potential and pH, the equilibrium concentrations are also dependent upon, e.g., temperature, pressure, and concentration. Pourbaix diagrams are commonly given at room temperature, atmospheric pressure, and molar concentrations of 10−6 and changing any of these parameters will yield a different diagram.

The diagrams are named after Marcel Pourbaix (1904–1998), the Russian-born Belgian chemist who invented them.
Naming

Pourbaix diagrams are also known as EH-pH diagrams due to the labeling of the two axes.
Diagram
The vertical axis is labeled EH for the voltage potential with respect to the standard hydrogen electrode (SHE) as calculated by the Nernst equation. The "H" stands for hydrogen, although other standards may be used, and they are for room temperature only.
For a reversible redox reaction described by the following chemical equilibrium:
- a A + b B ⇌ c C + d D
With the corresponding equilibrium constant K:

The Nernst equation is:


sometimes formulated as:

or, more simply directly expressed numerically as:

where:
volt is the thermal voltage or the "Nernst slope" at standard temperature
- λ = ln(10) ≈ 2.30, so that
volt.
The horizontal axis is labeled pH for the −log function of the H+ ion activity.

The lines in the Pourbaix diagram show the equilibrium conditions, that is, where the activities are equal, for the species on each side of that line. On either side of the line, one form of the species will instead be said to be predominant.
In order to draw the position of the lines with the Nernst equation, the activity of the chemical species at equilibrium must be defined. Usually, the activity of a species is approximated as equal to the concentration (for soluble species) or partial pressure (for gases). The same values should be used for all species present in the system.
For soluble species, the lines are often drawn for concentrations of 1 M or 10−6 M. Sometimes additional lines are drawn for other concentrations.
If the diagram involves the equilibrium between a dissolved species and a gas, the pressure is usually set to P0 = 1 atm = 101325 Pa, the minimum pressure required for gas evolution from an aqueous solution at standard conditions.
In addition, changes in temperature and concentration of solvated ions in solution will shift the equilibrium lines in accordance with the Nernst equation.
The diagrams also do not take kinetic effects into account, meaning that species shown as unstable might not react to any significant degree in practice.
A simplified Pourbaix diagram indicates regions of "immunity", "corrosion" and "passivity", instead of the stable species. They thus give a guide to the stability of a particular metal in a specific environment. Immunity means that the metal is not attacked, while corrosion shows that general attack will occur. Passivation occurs when the metal forms a stable coating of an oxide or other salt on its surface, the best example being the relative stability of aluminium because of the alumina layer formed on its surface when exposed to air.
Applicable chemical systems

While such diagrams can be drawn for any chemical system, it is important to note that the addition of a metal binding agent (ligand) will often modify the diagram. For instance, carbonate (CO2−3) has a great effect upon the diagram for uranium. (See diagrams at right). The presence of trace amounts of certain species such as chloride ions can also greatly affect the stability of certain species by destroying passivating layers.
Limitations
Even though Pourbaix diagrams are useful for a metal corrosion potential estimation they have, however, some important limitations:: 111
- Equilibrium is always assumed, though in practice it may differ.
- The diagram does not provide information on actual corrosion rates.
- Does not apply to alloys.
- Does not indicate whether passivation (in the form of oxides or hydroxides) is protective or not. Diffusion of oxygen ions through thin oxide layers are possible.
- Excludes corrosion by chloride ions (Cl−, Cl3+ etc.).
- Usually applicable only to temperature of 25 °C (77 °F), which is assumed by default. The Pourbaix diagrams for higher temperatures exist.
Expression of the Nernst equation as a function of pH
The 


The equilibrium constant K of this reduction reaction is:

where curly braces { } indicate activities (a), rectangle braces [ ] denote molar or molal concentrations (C), 
Activities correspond to thermodynamic concentrations and take into account the electrostatic interactions between ions present in solution. When the concentrations are not too high, the activity (


The half-cell standard reduction potential 

where 

In the following, the Nernst slope (or thermal voltage) 

This equation is the equation of a straight line for 
This equation predicts lower
Calculation of a Pourbaix diagram
When the activities (

There are three types of line boundaries in a Pourbaix diagram: Vertical, horizontal, and sloped.
Vertical boundary line
When no electrons are exchanged (z = 0), the equilibrium between A, B, C, and D only depends on [H+] and is not affected by the electrode potential. In this case, the reaction is a classical acid-base reaction involving only protonation/deprotonation of dissolved species. The boundary line will be a vertical line at a particular value of pH. The reaction equation may be written:

and the energy balance is written as 

Thus:

or, in base-10 logarithms,

which may be solved for the particular value of pH.
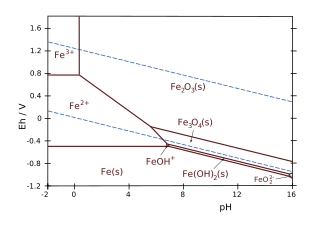
For example consider the iron and water system, and the equilibrium line between the ferric ion Fe3+ ion and hematite Fe2O3. The reaction equation is:

which has 

Because the activities (or the concentrations) of the solid phases and water are equal to unity:
[Fe2O3] = [H2O] = 1, the pH only depends on the concentration in dissolved Fe3+
:

At STP, for [Fe3+] = 10−6, this yields pH = 1.76.
Horizontal boundary line
When H+ and OH− ions are not involved in the reaction, the boundary line is horizontal and independent of pH.
The reaction equation is thus written:

As, the standard Gibbs free energy

Using the definition of the electrode potential ∆G = -zFE, where F is the Faraday constant, this may be rewritten as a Nernst equation:

or, using base-10 logarithms:

For the equilibrium Fe2+
/Fe3+
, taken as example here, considering the boundary line between Fe2+ and Fe3+, the half-reaction equation is:

Since H+ ions are not involved in this redox reaction, it is independent of pH. Eo = 0.771 V with only one electron involved in the redox reaction. The potential Eh is a function of temperature via the thermal voltage 
and Fe3+
ions:

For both ionic species at the same concentration (e.g., 

Sloped boundary line
In this case, both electrons and H+ ions are involved and the electrode potential is a function of pH. The reaction equation may be written:
Using the expressions for the free energy in terms of potentials, the energy balance is given by a Nernst equation:

For the iron and water example, considering the boundary line between the ferrous ion Fe2+ and hematite Fe2O3, the reaction equation is:

- with
.
The equation of the boundary line, expressed in base-10 logarithms is:

As, the activities, or the concentrations, of the solid phases and water are always taken equal to unity by convention in the definition of the equilibrium constant K: [Fe2O3] = [H2O] = 1.
The Nernst equation thus limited to the dissolved species Fe2+
and H+ is written as:

For, [Fe2+] = 10−6 M, this yields:

Note the negative slope (-0.1775) of this line in a Eh–pH diagram.
The stability region of water

In many cases, the possible conditions in a system are limited by the stability region of water. In the Pourbaix diagram for uranium presented here above, the limits of stability of water are marked by the two dashed green lines, and the stability region for water falls between these two lines. It is also depicted here beside by the two dashed red lines in the simplified Pourbaix diagram restricted to the water stability region only.
Under highly reducing conditions (low EH), water is reduced to hydrogen according to:
(at low pH)
and,
(at high pH)
Using the Nernst equation, setting E0 = 0 V as defined by convention for the standard hydrogen electrode (SHE, serving as reference in the reduction potentials series) and the hydrogen gas fugacity (corresponding to chemical activity for a gas) at 1, the equation for the lower stability line of water in the Pourbaix diagram at standard temperature and pressure is:


Below this line, water is reduced to hydrogen, and it will usually not be possible to pass beyond this line as long as there is still water present in the system to be reduced.
Correspondingly, under highly oxidizing conditions (high EH) water is oxidized into oxygen gas according to:
(at low pH)
and,
(at high pH)
Using the Nernst equation as above, but with E0 = −ΔG0H2O/2F = 1.229 V for water oxidation, gives an upper stability limit of water as a function of the pH value:


at standard temperature and pressure. Above this line, water is oxidized to form oxygen gas, and it will usually not be possible to pass beyond this line as long as there is still water present in the system to be oxidized.
The two upper and lower stability lines having the same negative slope (−59 mV/pH unit), they are parallel in a Pourbaix diagram and the reduction potential decreases with pH.
Applications
Pourbaix diagrams have many applications in different fields dealing with e.g., corrosion problems, geochemistry, and environmental sciences. Using the Pourbaix diagram correctly will help shedding light not only on the nature of the species present in aqueous solution, or in the solid phases, but may also help to understand the reaction mechanism.
Concept of pe in environmental chemistry
Pourbaix diagrams are widely used to describe the behaviour of chemical species in the hydrosphere. In this context, reduction potential pe is often used instead of EH. The main advantage is to directly work with a logarithm scale. pe is a dimensionless number and can easily be related to EH by the equation:

Where, 
Moreover,
, an expression with a similar form to that of pH.
pe values in environmental chemistry ranges from −12 to +25, since at low or high potentials water will be respectively reduced or oxidized. In environmental applications, the concentration of dissolved species is usually set to a value between 10−2 M and 10−5 M for the determination of the equilibrium lines.
Gallery
-
 Fe–H2O
 -
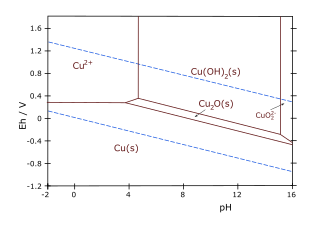 Cu–H2O
 -
 Au–H2O
 -
 Al–H2O
 -
 Mn–H2O
 -
 Zn–H2O–CO32–
 -
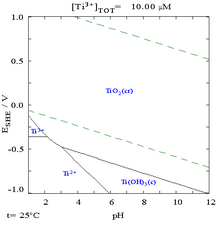 Ti–H2O


See also
Notes
References
- Brookins, D.G. (1988). Eh-pH Diagrams for Geochemistry. Springer-Verlag. ISBN 0-387-18485-6.
- Jones, Denny A. (1996). Principles and Prevention of Corrosion (2nd ed.). Prentice Hall. pp. 50–52. ISBN 0-13-359993-0.
- Pourbaix, M. (1974). Atlas of electrochemical equilibria in aqueous solutions (2nd ed.). National Association of Corrosion Engineers. ISBN 9780915567980.
- Takeno, Naoto (May 2005). Atlas of Eh-pH diagrams (Intercomparison of thermodynamic databases) (PDF) (Report). Tsukuba, Ibaraki, Japan: National Institute of Advanced Industrial Science and Technology: Research Center for Deep Geological Environments. Retrieved 2017-05-16.
External links
- Marcel Pourbaix — Corrosion Doctors
- DoITPoMS Teaching and Learning Package- "The Nernst Equation and Pourbaix Diagrams"
Software
- ChemEQL Free software for calculation of chemical equilibria from Eawag.
- FactSage Commercial thermodynamic databank software, also available in a free web application.
- The Geochemist's Workbench Commercial geochemical modeling software from Aqueous Solutions LLC.
- GWB Community Edition Free download of the popular geochemical modeling software package.
- HYDRA/MEDUSA Free software for creating chemical equilibrium diagrams from the KTH Department of Chemistry.
- HSC Chemistry Commercial thermochemical calculation software from Outotec Oy.
- PhreePlot Free program for making geochemical plots using the USGS code PHREEQC.
- Thermo-Calc Windows Commercial software for thermodynamic calculations from Thermo-Calc Software.
- Materials Project Public website that can generate Pourbaix diagrams from a large database of computed material properties, hosted at NERSC.
This article uses material from the Wikipedia English article Pourbaix diagram, which is released under the Creative Commons Attribution-ShareAlike 3.0 license ("CC BY-SA 3.0"); additional terms may apply (view authors). Content is available under CC BY-SA 4.0 unless otherwise noted. Images, videos and audio are available under their respective licenses.
®Wikipedia is a registered trademark of the Wiki Foundation, Inc. Wiki English (DUHOCTRUNGQUOC.VN) is an independent company and has no affiliation with Wiki Foundation.