Demographics Of Hungary
Demographic features of the population of Hungary include population density, ethnicity, education level, health of the populace, economic status, religious affiliations and other aspects.
| Demographics of Hungary | |
|---|---|
 Population Pyramid 2020 | |
| Population | |
| Growth rate | −4.9 births/1,000 population (2020) |
| Birth rate | 9.5 births/1,000 population (2020) |
| Death rate | 14.3 deaths/1,000 population (2020) |
| Life expectancy | 76.16 years (2019) |
| • male | 72.86 years (2019) |
| • female | 79.33 years (2019) |
| Fertility rate | 1.52 children born/woman (2022) |
| Infant mortality rate | 3.4 / 1000 live births (2020) |
| Age structure | |
| 0–14 years | 14.8% |
| 15–64 years | 67.7% |
| 65 and over | 17.5% |
| Sex ratio | |
| At birth | 1.06 male(s)/female (2013 est.) |
| Under 15 | 1.06 male(s)/female |
| 15–64 years | 0.96 male(s)/female |
| 65 and over | 0.59 male(s)/female |
| Nationality | |
| Nationality | noun: Hungarian(s) adjective: Hungarian |
| Major ethnic | Hungarians |
| Language | |
| Spoken | Hungarian |
Population

| Year | Pop. | ±% p.a. |
|---|---|---|
| 1784 | 2,681,595 | — |
| 1870 | 5,011,310 | +0.73% |
| 1880 | 5,329,191 | +0.62% |
| 1890 | 6,009,351 | +1.21% |
| 1900 | 6,854,415 | +1.32% |
| 1910 | 7,612,114 | +1.05% |
| 1920 | 7,986,875 | +0.48% |
| 1930 | 8,685,109 | +0.84% |
| 1941 | 9,316,074 | +0.64% |
| 1949 | 9,204,799 | −0.15% |
| 1960 | 9,961,044 | +0.72% |
| 1970 | 10,300,996 | +0.34% |
| 1980 | 10,709,463 | +0.39% |
| 1990 | 10,374,823 | −0.32% |
| 2001 | 10,200,298 | −0.15% |
| 2011 | 9,937,628 | −0.26% |
| 2022 | 9,603,634 | −0.31% |
| Note: Only present territory of Hungary | ||
Hungary's population has been slowly declining since 1980. The population composition at the foundation of Hungary (895) depends on the size of the arriving Hungarian population and the size of the Slavic (and remains of Avar-Slavic) population at the time. One source mentions 200 000 Slavs and 400 000 Hungarians, while other sources often don't give estimates for both, making comparison more difficult. The size of the Hungarian population around 895 is often estimated between 120 000 and 600 000, with a number of estimates in the 400-600 000 range. Other sources only mention a fighting force of 25 000 Magyar warriors used in the attack, while declining to estimate the total population including women and children and warriors not participating in the invasion. In the historical demographics the largest earlier shock was the Mongol Invasion of Hungary, several plagues also took a toll on the country's population.
According to the demographers, about 80 percent of the population was made up of Hungarians before the Battle of Mohács, however the Hungarian ethnic group became a minority in its own country in the 18th century due to the resettlement policies and continuous immigration from neighboring countries. Major territorial changes made Hungary ethnically homogeneous after World War I. Nowadays, more than nine-tenths of the population is ethnically Hungarian and speaks Hungarian as the mother tongue.

Population over time
| Population of Hungary over time with estimated percentages of ethnic Hungarians within Hungary | |||
|---|---|---|---|
| Date | Estimated Population | Estimated Percentages of Hungarian people, with and without Inclusion of the Kingdom of Croatia | Notes |
| c. 900 AD |
| 66% | Size of the country was about 330 thousand square km, with a density of 3-4.5 or 0.56-1.06 persons per square km |
| 1000 | 1,000,000-1,500,000 |  | |
| 1060 | 500,000-550,000 | A density of 1.51-1.67 persons per square km. | |
| 1100 | 2,000,000 | ||
| 1181 | 2,600,000 | ||
| 1200 | 1,000,000-1,100,000 | A density of 3.03-3.33 persons per square km (330 thousand square km). | |
| 1222 | 2,000,000 | 70–80% | The time of the Golden Bull. The last estimate before the Tatar invasion. |
| 1242 |
| Population decreased after the Mongol invasion of Hungary (estimates of population loss range from 20% to 50%). | |
| 1300 |
| ||
| 1348 |
| Before the plague (at the time of the Angevin kings). | |
| 1370 | c. 2,000,000 | 60–70% (including Croatia) | |
| 1400 |
| ||
| 1490 |
|
| Before the Ottoman conquest (about 3.2 million Hungarians).  |
| 1600 |
| Populations of Royal Hungary, Transylvania, and Ottoman Hungary combined. | |
| 1699 |
|
| At the time of Treaty of Karlowitz (not more than 2 million Hungarians). |
| 1711 |
|
| At the end of the Kuruc War, starting date of the organized resettlement. |
| 1720 |
|
| |
| 1785-87 | 8,000,000 | 5% urban subjects. | |
| 1790 |
|
| End of the organized resettlement (around 800 new German villages had been established between 1711 and 1780).  |
| 1828 | 11,495,536 | ||
| 1830 |
| ||
| 1837 |
| ||
| 1846 | 12,033,399 |
| Two years before the Hungarian Revolution of 1848. |
| 1850 | 11,600,000 |
| |
| 1857 | 13,830,870 | 44.5% | |
| 1869 | 13,508,000 | 45.2% | |
| 1880 | 13,749,603 | 46% | |
| 1900 | 16,838,255 | 51.4% | |
| 1910 | 18,264,533 |
| 5% Jews (estimated according to their religion).  |
Note: The data refer to the territory of the Kingdom of Hungary, and not that of the present-day republic.
Demographics of Kingdom of Hungary, (1910 Census)

| Land | Mother tongues (1910 census) |
|---|---|
| Kingdom of Hungary | Hungarian (54.4%), Romanian (16.1%), Slovak (10.7%), German (10.4%), Ruthenian (2.5%), Serbian (2.5%), Croatian (1.8%) |
| Kingdom of Croatia-Slavonia | Croatian (62.5%), Serbian (24.6%), German (5.0%), Hungarian (4.1%) |
| Land | Hungarian | Romanian | German | Slovak | Croatian | Serbian | Ruthenian | Other | Total |
|---|---|---|---|---|---|---|---|---|---|
| Danube Right Bank | 72% (2,221,295) | 0% (833) | 18% (555,694) | 0.6% (17,188) | 5.5% (168,436) | 0.5% (15,170) | 0% (232) | 3.4% (105,556) | 14.8% (3,084,404) |
| Danube Left Bank | 32.7% (711,654) | 0% (704) | 6.6% (144,395) | 58.8% (1,279,574) | 0.1% (2,294) | 0% (200) | 0% (393) | 1.7% (36,710) | 10.4% (2,175,924) |
| Danube-Tisza | 81.2% (3,061,066) | 0.1% (4,813) | 9.5% (357,822) | 2.1% (79,354) | 0.1% (4,866) | 4.1% (154,298) | 0.3% (11,121) | 4.1% (96,318) | 18% (3,769,658) |
| Tisza Right Bank | 53.5% (945,990) | 0.1% (1,910) | 5.6% (98,564) | 25% (441,776) | 0% (486) | 0% (247) | 14.3% (253,062) | 1.6% (27,646) | 8.5% (1,769,681) |
| Tisza Left Bank | 61.8% (1,603,924) | 24% (621,918) | 3.2% (83,229) | 3.1% (81,154) | 0% (327) | 0% (321) | 7.5% (194,504) | 0.3% (8,547) | 12.4% (2,594,924) |
| Tisza-Maros | 22.2% (474,988) | 39.5% (845,850) | 19.9% (427,253) | 2.1% (44,715) | 0.2% (4,950) | 13.6% (290,434) | 0.1% (3,188) | 2.4% (50,391) | 10.3% (2,141,769) |
| Transylvania | 34.3% (918,217) | 55% (1,472,021) | 8.7% (234,085) | 0.1% (2,404) | 0% (523) | 0% (421) | 0.1% (1,759) | 1.8% (48,937) | 12.8% (2,678,367) |
| Fiume | 13% (6,493) | 0.3% (137) | 4.6% (2,315) | 0.4% (192) | 26% (12,926) | 0.9% (425) | 0% (11) | 54.8 (27,307, mostly Italian) | 0.2% (49,806) |
| Croatia-Slavonia | 4% (105,948) | 0% (846) | 5.1% (134,078) | 0.8% (21,613) | 62.5% (1,638,354) | 24.6% (644,955) | 0.3% (8,317) | 2.6% (67,843) | 12.6% (2,621,954) |
| Total | 48.1% (10,050,575) | 14.1% (2,949,032) | 9.8% (2,037,435) | 9.4% (1,967,970) | 8.8% (1,833,162) | 5.3% (1,106,471) | 2.3% (472,587) | 2.2% (469,255) | 100% (20,886,487) |
-
 In the Kingdom of Hungary, the 1910 census was based on mother tongue. According to the census, 54.4% of the inhabitants of Hungary were recorded to speak Hungarian as their native language. This number included the Jewish ethnic group (around 5% of the population according to a separate census on religion and about 23% of Budapest's citizenry) who were overwhelmingly Hungarian-speaking (the Jews tending to declare German as mother tongue due to the immigration of Jews of Yiddish/German mother tongue).
 -
 Ethnic Map of Hungary 1910 with Counties
 -
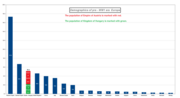 Demographics of pre-WW1 Kingdom of Hungary (marked with green) in Europe


Fertility

| 1.7 - 1.9 1.5 - 1.7 1.4 - 1.5 1.3 - 1.4 < 1.3 |
The total fertility rate is the number of children born per woman. It is based on fairly good data for the entire period in the present-day Hungary. Sources: Our World In Data and Gapminder Foundation.
| Years | 1850 | 1851 | 1852 | 1853 | 1854 | 1855 | 1856 | 1857 | 1858 | 1859 | 1860 |
|---|---|---|---|---|---|---|---|---|---|---|---|
| Total Fertility Rate in Hungary | 5.18 | 5.15 | 5.12 | 5.09 | 5.06 | 5.03 | 5 | 4.97 | 4.94 | 4.91 | 4.88 |
| Years | 1861 | 1862 | 1863 | 1864 | 1865 | 1866 | 1867 | 1868 | 1869 | 1870 |
|---|---|---|---|---|---|---|---|---|---|---|
| Total Fertility Rate in Hungary | 4.85 | 5.11 | 5.41 | 5.03 | 5.11 | 5.02 | 4.64 | 5.09 | 5.12 | 5.14 |
| Years | 1871 | 1872 | 1873 | 1874 | 1875 | 1876 | 1877 | 1878 | 1879 | 1880 |
|---|---|---|---|---|---|---|---|---|---|---|
| Total Fertility Rate in Hungary | 5.23 | 4.96 | 5.18 | 5.23 | 5.55 | 5.61 | 5.29 | 5.23 | 5.58 | 5.23 |
| Years | 1881 | 1882 | 1883 | 1884 | 1885 | 1886 | 1887 | 1888 | 1889 | 1890 |
|---|---|---|---|---|---|---|---|---|---|---|
| Total Fertility Rate in Hungary | 5.28 | 5.4 | 5.5 | 5.59 | 5.48 | 5.57 | 5.41 | 5.36 | 5.35 | 4.93 |
| Years | 1891 | 1892 | 1893 | 1894 | 1895 | 1896 | 1897 | 1898 | 1899 | 1900 |
|---|---|---|---|---|---|---|---|---|---|---|
| Total Fertility Rate in Hungary | 5.2 | 4.96 | 5.25 | 5.08 | 5.48 | 5.11 | 4.97 | 4.95 | 4.62 | 4.79 |
|
|
Total Fertility Rate by county
| County | 1980 | 1990 | 2001 | 2011 |
|---|---|---|---|---|
| Baranya | 1.70 | 1.65 | 1.52 | 1.47 |
| Bács-Kiskun | 1.81 | 1.73 | 1.59 | 1.56 |
| Békés | 1.82 | 1.75 | 1.62 | 1.57 |
| Borsod-Abaúj-Zemplén | 1.88 | 1.83 | 1.72 | 1.66 |
| Csongrád | 1.59 | 1.55 | 1.44 | 1.41 |
| Fejér | 1.85 | 1.79 | 1.62 | 1.56 |
| Győr-Moson-Sopron | 1.81 | 1.73 | 1.56 | 1.49 |
| Hajdú-Bihar | 1.92 | 1.82 | 1.65 | 1.56 |
| Heves | 1.79 | 1.69 | 1.57 | 1.53 |
| Jász-Nagykun-Szolnok | 1.90 | 1.80 | 1.67 | 1.62 |
| Komárom-Esztergom | 1.80 | 1.73 | 1.58 | 1.53 |
| Nógrád | 1.84 | 1.76 | 1.64 | 1.60 |
| Pest | 1.76 | 1.69 | 1.54 | 1.48 |
| Somogy | 1.74 | 1.68 | 1.58 | 1.53 |
| Szabolcs-Szatmár-Bereg | 2.21 | 2.05 | 1.85 | 1.75 |
| Tolna | 1.83 | 1.76 | 1.65 | 1.60 |
| Vas | 1.82 | 1.72 | 1.58 | 1.51 |
| Veszprém | 1.88 | 1.79 | 1.64 | 1.58 |
| Zala | 1.78 | 1.73 | 1.56 | 1.52 |
| Budapest | 1.25 | 1.27 | 1.17 | 1.13 |
| All | 1.71 | 1.65 | 1.53 | 1.47 |
Source: 2011 census
Life expectancy


| Period | Life expectancy in Years |
|---|---|
| 1950–1955 | 64.01 |
| 1955–1960 |  66.91 66.91 |
| 1960–1965 | 68.79 |
| 1965–1970 | 69.45 |
| 1970–1975 |  69.41 69.41 |
| 1975–1980 | 69.59 |
| 1980–1985 | 69.08 |
| 1985–1990 | 69.42 |
| 1990–1995 | 69.41 |
| 1995–2000 | 70.88 |
| 2000–2005 | 72.54 |
| 2005–2010 | 73.74 |
| 2010–2015 | 75.26 |
| 2015–2020 | 76.65 |
Infant mortality rate
The infant mortality rate (IMR) decreased considerably after WW II. In 1949, the IMR was 91.0. The rate decreased to 47.6 in 1960, 35.9 in 1970, 23.2 in 1980, 14.8 in 1990, 9.2 in 2000 and reached an all-time low in 2018: 3.4 per 1000 live born children.
Vital statistics
Source: Hungarian Central Statistical Office
| Average population (January 1) | Live births | Deaths | Natural change | Crude birth rate (per 1000) | Crude death rate (per 1000) | Natural change (per 1000) | Crude migration change (per 1000) | Total fertility rates | |
|---|---|---|---|---|---|---|---|---|---|
| 1900 | 6,854,000 | 268,019 | 177,363 | 90,656 | 39.4 | 27.0 | 12.4 | 5.28 | |
| 1901 | 260,439 | 166,662 | 93,777 | 37.6 | 25.0 | 12.6 | 5.22 | ||
| 1902 | 270,385 | 179,260 | 91,125 | 38.6 | 26.9 | 11.7 | 5.16 | ||
| 1903 | 258,209 | 179,518 | 78,691 | 36.5 | 26.1 | 10.4 | 5.10 | ||
| 1904 | 260,446 | 172,704 | 87,742 | 37.0 | 24.8 | 12.2 | 5.04 | ||
| 1905 | 252,501 | 203,516 | 48,985 | 35.5 | 27.8 | 7.7 | 4.98 | ||
| 1906 | 258,296 | 176,938 | 81,358 | 36.1 | 24.9 | 11.2 | 4.91 | ||
| 1907 | 261,231 | 180,216 | 81,015 | 36.2 | 25.6 | 10.6 | 4.85 | ||
| 1908 | 268,637 | 177,872 | 90,765 | 36.7 | 25.0 | 11.7 | 4.79 | ||
| 1909 | 271,177 | 184,445 | 86,732 | 37.1 | 25.4 | 11.7 | 4.73 | ||
| 1910 | 7,612,000 | 265,457 | 168,875 | 96,582 | 35.4 | 23.4 | 12.0 | 4.67 | |
| 1911 | 261,375 | 184,009 | 77,366 | 34.8 | 24.8 | 10.0 | 4.59 | ||
| 1912 | 270,804 | 172,148 | 98,656 | 36.0 | 23.0 | 13.0 | 4.50 | ||
| 1913 | 264,418 | 174,241 | 90,177 | 34.3 | 23.2 | 11.1 | 4.42 | ||
| 1914 | 270,690 | 176,574 | 94,116 | 34.5 | 23.4 | 11.1 | 4.34 | ||
| 1915 | 187,734 | 189,418 | -1,684 | 23.7 | 25.3 | -1.6 | 4.26 | ||
| 1916 | 135,443 | 159,810 | -24,367 | 16.8 | 20.9 | -4.1 | 4.17 | ||
| 1917 | 130,817 | 163,507 | -32,690 | 16.0 | 20.7 | -4.7 | 4.09 | ||
| 1918 | 127,894 | 207,395 | -79,501 | 15.3 | 25.7 | -10.4 | 4.01 | ||
| 1919 | 7,860,000 | 217,431 | 157,392 | 60,039 | 27.6 | 20.0 | 7.6 | 8.6 | 3.93 |
| 1920 | 7,987,000 | 249,458 | 169,717 | 79,741 | 31.4 | 21.4 | 10.0 | -5.9 | 3.84 |
| 1921 | 8,020,000 | 255,453 | 170,059 | 85,394 | 31.8 | 21.2 | 10.6 | -3.1 | 3.81 |
| 1922 | 8,080,000 | 249,279 | 173,351 | 75,928 | 30.8 | 21.4 | 9.4 | 1.7 | 3.60 |
| 1923 | 8,170,000 | 238,971 | 159,287 | 79,684 | 29.2 | 19.5 | 9.8 | -3.7 | 3.39 |
| 1924 | 8,220,000 | 221,462 | 167,668 | 53,794 | 26.9 | 20.4 | 6.5 | 3.2 | 3.18 |
| 1925 | 8,300,000 | 235,480 | 142,150 | 93,330 | 28.3 | 17.1 | 11.2 | -2.8 | 3.36 |
| 1926 | 8,370,000 | 229,484 | 139,905 | 89,579 | 27.4 | 16.7 | 10.7 | 3.6 | 3.24 |
| 1927 | 8,490,000 | 218,548 | 150,675 | 67,873 | 25.8 | 17.8 | 8.0 | -5.6 | 3.05 |
| 1928 | 8,510,000 | 224,693 | 146,496 | 78,197 | 26.4 | 17.2 | 9.2 | -1.0 | 3.08 |
| 1929 | 8,580,000 | 215,463 | 152,847 | 62,976 | 25.1 | 17.8 | 7.3 | 4.9 | 2.92 |
| 1930 | 8,685,000 | 219,784 | 134,341 | 85,443 | 25.4 | 15.5 | 9.9 | -4.7 | 2.84 |
| 1931 | 8,730,000 | 206,925 | 144,968 | 61,957 | 23.7 | 16.6 | 7.1 | -1.0 | 2.84 |
| 1932 | 8,783,000 | 205,529 | 157,106 | 48,423 | 23.4 | 17.9 | 5.5 | 1.6 | 2.78 |
| 1933 | 8,845,000 | 193,911 | 129,913 | 63,998 | 21.9 | 14.7 | 7.2 | 0.7 | 2.72 |
| 1934 | 8,915,000 | 194,279 | 129,049 | 65,230 | 21.8 | 14.5 | 7.3 | 0 | 2.57 |
| 1935 | 8,980,000 | 189,479 | 136,923 | 52,556 | 21.1 | 15.2 | 5.9 | 0.8 | 2.55 |
| 1936 | 9,040,000 | 183,369 | 128,333 | 55,036 | 20.3 | 14.2 | 6.1 | 0.5 | 2.48 |
| 1937 | 9,100,000 | 182,449 | 128,049 | 54,400 | 20.0 | 14.1 | 6.0 | 0.5 | 2.42 |
| 1938 | 9,159,000 | 182,206 | 130,628 | 51,578 | 19.9 | 14.3 | 5.6 | 0.8 | 2.46 |
| 1939 | 9,217,000 | 178,633 | 124,591 | 54,042 | 19.4 | 13.5 | 5.9 | 0.9 | 2.50 |
| 1940 | 9,280,000 | 185,562 | 132,735 | 52,827 | 20.0 | 14.3 | 5.7 | -1.8 | 2.48 |
| 1941 | 9,316,000 | 177,047 | 123,349 | 53,698 | 19.0 | 13.2 | 5.7 | 2.5 | 2.52 |
| 1942 | 9,392,000 | 187,187 | 136,844 | 50,343 | 19.9 | 14.6 | 5.4 | -0.3 | 2.55 |
| 1943 | 9,440,000 | 173,295 | 127,158 | 46,137 | 18.4 | 13.5 | 4.9 | -25.0 | 2.55 |
| 1944 | 9,250,000 | 190,000 | 144,048 | 45,952 | 20.5 | 15.6 | 5.0 | -26.1 | 2.61 |
| 1945 | 9,055,000 | 169,091 | 211,323 | -42,232 | 18.7 | 23.3 | -4.7 | 3.3 | 2.64 |
| 1946 | 9,042,000 | 169,120 | 135,486 | 33,634 | 18.7 | 15.0 | 3.7 | 1.9 | 2.67 |
| 1947 | 9,093,000 | 187,316 | 117,537 | 69,779 | 20.6 | 12.9 | 7.7 | -0.6 | 2.70 |
| 1948 | 9,158,000 | 191,907 | 105,780 | 86,127 | 21.0 | 11.6 | 9.4 | -4.3 | 2.73 |
| 1949 | 9,205,000 | 190,398 | 105,718 | 84,680 | 20.6 | 11.4 | 9.2 | 0.4 | 2.76 |
| 1950 | 9,293,000 | 195,567 | 106,902 | 88,665 | 20.9 | 11.4 | 9.5 | 0.2 | 2.77 |
| 1951 | 9,383,000 | 190,645 | 109,998 | 80,647 | 20.2 | 11.7 | 8.6 | -0.1 | 2.76 |
| 1952 | 9,463,000 | 185,820 | 107,443 | 78,377 | 19.6 | 11.3 | 8.2 | 0.5 | 2.72 |
| 1953 | 9,545,000 | 206,926 | 112,039 | 94,887 | 21.6 | 11.7 | 9.9 | 0.6 | 2.67 |
| 1954 | 9,645,000 | 223,347 | 106,670 | 116,677 | 23.0 | 11.0 | 12.0 | 0.6 | 2.61 |
| 1955 | 9,767,000 | 210,430 | 97,848 | 112,582 | 21.4 | 10.0 | 11.5 | 0.4 | 2.53 |
| 1956 | 9,883,000 | 192,810 | 104,236 | 88,574 | 19.5 | 10.5 | 8.9 | -14.4 | 2.44 |
| 1957 | 9,829,000 | 167,202 | 103,645 | 63,557 | 17.0 | 10.5 | 6.5 | -4.4 | 2.34 |
| 1958 | 9,850,000 | 158,428 | 97,866 | 60,562 | 16.0 | 9.9 | 6.1 | 0.3 | 2.23 |
| 1959 | 9,913,000 | 151,194 | 103,880 | 47,314 | 15.2 | 10.5 | 4.8 | 0 | 2.12 |
| 1960 | 9,961,000 | 146,461 | 101,525 | 44,936 | 14.7 | 10.2 | 4.5 | 0.1 | 2.02 |
| 1961 | 10,007,000 | 140,365 | 96,410 | 43,955 | 14.0 | 9.6 | 4.4 | 0.1 | 1.94 |
| 1962 | 10,052,000 | 130,053 | 108,273 | 21,780 | 12.9 | 10.8 | 2.2 | 0 | 1.79 |
| 1963 | 10,074,000 | 132,335 | 99,871 | 32,464 | 13.1 | 9.9 | 3.2 | 0.2 | 1.82 |
| 1964 | 10,108,000 | 132,141 | 100,830 | 31,311 | 13.1 | 10.0 | 3.1 | 0.1 | 1.81 |
| 1965 | 10,140,000 | 133,009 | 108,119 | 24,890 | 13.1 | 10.7 | 2.5 | 0.1 | 1.82 |
| 1966 | 10,166,000 | 138,489 | 101,943 | 36,546 | 13.6 | 10.0 | 3.6 | 0 | 1.89 |
| 1967 | 10,203,000 | 148,886 | 109,530 | 39,356 | 14.6 | 10.7 | 3.9 | 0.1 | 2.01 |
| 1968 | 10,244,000 | 154,419 | 115,354 | 39,065 | 15.1 | 11.2 | 3.8 | 0.1 | 2.06 |
| 1969 | 10,284,000 | 154,318 | 116,659 | 37,659 | 15.0 | 11.3 | 3.7 | 0 | 2.03 |
| 1970 | 10,322,000 | 151,819 | 120,197 | 31,622 | 14.7 | 11.6 | 3.1 | -0.2 | 1.98 |
| 1971 | 10,352,000 | 150,640 | 123,009 | 27,631 | 14.5 | 11.9 | 2.7 | -0.2 | 1.93 |
| 1972 | 10,378,000 | 153,265 | 118,991 | 34,274 | 14.7 | 11.4 | 3.3 | -0.2 | 1.92 |
| 1973 | 10,410,000 | 156,224 | 123,366 | 32,858 | 15.0 | 11.8 | 3.1 | 0 | 1.93 |
| 1974 | 10,442,000 | 186,288 | 125,816 | 60,472 | 17.8 | 12.0 | 5.8 | -0.1 | 2.27 |
| 1975 | 10,501,000 | 194,240 | 131,102 | 63,138 | 18.4 | 12.4 | 6.0 | -0.1 | 2.34 |
| 1976 | 10,563,000 | 185,405 | 132,240 | 53,165 | 17.5 | 12.5 | 5.0 | -0.1 | 2.23 |
| 1977 | 10,615,000 | 177,574 | 132,031 | 45,543 | 16.7 | 12.4 | 4.3 | -0.1 | 2.15 |
| 1978 | 10,660,000 | 168,160 | 140,121 | 28,039 | 15.7 | 13.1 | 2.6 | -0.1 | 2.06 |
| 1979 | 10,687,000 | 160,364 | 136,829 | 23,535 | 15.0 | 12.8 | 2.2 | -0.1 | 2.00 |
| 1980 | 10,709,000 | 148,673 | 145,355 | 3,318 | 13.9 | 13.6 | 0.3 | -0.7 | 1.91 |
| 1981 | 10,705,000 | 142,890 | 144,757 | -1,867 | 13.3 | 13.5 | -0.2 | -0.7 | 1.87 |
| 1982 | 10,695,000 | 133,559 | 144,318 | -10,759 | 12.5 | 13.5 | -1.0 | -1.2 | 1.79 |
| 1983 | 10,671,000 | 127,258 | 148,643 | -21,385 | 11.9 | 13.9 | -2.0 | -0.9 | 1.74 |
| 1984 | 10,640,000 | 125,359 | 146,709 | -21,350 | 11.8 | 13.8 | -2.0 | -1.9 | 1.75 |
| 1985 | 10,599,000 | 130,200 | 147,614 | -17,414 | 12.2 | 13.9 | -1.6 | -2.1 | 1.85 |
| 1986 | 10,560,000 | 128,204 | 147,089 | -18,885 | 12.1 | 13.8 | -1.8 | -3.0 | 1.84 |
| 1987 | 10,509,000 | 125,840 | 142,601 | -16,761 | 11.9 | 13.4 | -1.6 | -2.7 | 1.82 |
| 1988 | 10,464,000 | 124,296 | 140,042 | -15,746 | 11.7 | 13.2 | -1.5 | -2.6 | 1.81 |
| 1989 | 10,421,000 | 123,304 | 144,695 | -21,391 | 11.8 | 13.8 | -2.0 | -2.4 | 1.80 |
| 1990 | 10,375,000 | 125,679 | 145,660 | -19,981 | 12.1 | 14.0 | -1.9 | 1.7 | 1.87 |
| 1991 | 10,373,400 | 127,207 | 144,813 | -17,606 | 12.3 | 14.0 | -1.7 | 1.8 | 1.88 |
| 1992 | 10,374,000 | 121,724 | 148,781 | -27,057 | 11.7 | 14.3 | -2.6 | 1.7 | 1.78 |
| 1993 | 10,365,000 | 117,033 | 150,244 | -33,211 | 11.3 | 14.5 | -3.2 | 1.8 | 1.69 |
| 1994 | 10,350,000 | 115,598 | 146,889 | -31,291 | 11.2 | 14.2 | -3.0 | 1.7 | 1.64 |
| 1995 | 10,337,000 | 112,054 | 145,431 | -33,377 | 10.8 | 14.1 | -3.2 | 1.7 | 1.57 |
| 1996 | 10,321,000 | 105,272 | 143,130 | -37,858 | 10.2 | 13.9 | -3.7 | 1.8 | 1.46 |
| 1997 | 10,301,000 | 100,350 | 139,434 | -39,084 | 9.8 | 13.5 | -3.8 | 1.8 | 1.38 |
| 1998 | 10,280,000 | 97,301 | 140,870 | -43,569 | 9.5 | 13.7 | -4.2 | 1.6 | 1.32 |
| 1999 | 10,253,000 | 94,645 | 143,210 | -48,565 | 9.2 | 14.0 | -4.7 | 1.7 | 1.28 |
| 2000 | 10,222,000 | 97,597 | 135,601 | -38,004 | 9.6 | 13.3 | -3.7 | 1.5 | 1.32 |
| 2001 | 10,200,000 | 97,047 | 132,183 | -35,136 | 9.5 | 13.0 | -3.4 | 0.9 | 1.31 |
| 2002 | 10,175,000 | 96,804 | 132,833 | -36,029 | 9.5 | 13.1 | -3.5 | 0.3 | 1.30 |
| 2003 | 10,142,000 | 94,647 | 135,823 | -41,176 | 9.3 | 13.4 | -4.1 | 1.6 | 1.27 |
| 2004 | 10,117,000 | 95,137 | 132,492 | -37,355 | 9.4 | 13.1 | -3.7 | 1.8 | 1.27 |
| 2005 | 10,098,000 | 97,496 | 135,732 | -38,236 | 9.7 | 13.5 | -3.8 | 1.7 | 1.30 |
| 2006 | 10,077,000 | 99,871 | 131,603 | -31,732 | 9.9 | 13.1 | -3.2 | 2.1 | 1.34 |
| 2007 | 10,066,000 | 97,613 | 132,938 | -35,325 | 9.7 | 13.2 | -3.5 | 1.4 | 1.31 |
| 2008 | 10,045,000 | 99,149 | 130,027 | -30,878 | 9.9 | 13.0 | -3.1 | 1.7 | 1.35 |
| 2009 | 10,031,000 | 96,442 | 130,414 | -33,972 | 9.6 | 13.0 | -3.4 | 1.7 | 1.32 |
| 2010 | 10,014,000 | 90,335 | 130,456 | -40,121 | 9.0 | 13.0 | -4.0 | 1.2 | 1.25 |
| 2011 | 9,986,000 | 88,049 | 128,795 | -40,746 | 8.8 | 12.9 | -4.1 | -1.3 | 1.23 |
| 2012 | 9,932,000 | 90,269 | 129,440 | -39,171 | 9.1 | 13.0 | -3.9 | 1.6 | 1.34 |
| 2013 | 9,909,000 | 88,689 | 126,778 | -38,089 | 9.0 | 12.8 | -3.9 | 0.7 | 1.34 |
| 2014 | 9,877,000 | 91,510 | 126,308 | -34,798 | 9.3 | 12.8 | -3.5 | 1.4 | 1.41 |
| 2015 | 9,856,000 | 91,690 | 131,697 | -40,007 | 9.3 | 13.4 | -4.1 | 1.5 | 1.44 |
| 2016 | 9,830,000 | 93,063 | 127,053 | -33,990 | 9.5 | 12.9 | -3.5 | 0.2 | 1.49 |
| 2017 | 9,798,000 | 91,577 | 131,674 | -40,097 | 9.4 | 13.5 | -4.1 | 2.1 | 1.49 |
| 2018 | 9,778,000 | 89,807 | 131,045 | -41,238 | 9.2 | 13.4 | -4.2 | 3.7 | 1.49 |
| 2019 | 9,773,000 | 89,193 | 129,603 | -40,410 | 9.1 | 13.3 | -4.1 | 3.8 | 1.49 |
| 2020 | 9,770,000 | 92,338 | 141,002 | -48,664 | 9.5 | 14.5 | -5.0 | 1.0 | 1.56 |
| 2021 | 9,731,000 | 93,039 | 155,621 | -62,582 | 9.6 | 16.0 | -6.4 | 2.1 | 1.59 |
| 2022 | 9,689,000 | 88,491 | 136,446 | -47,955 | 9.1 | 14.1 | -5.0 | -4.5 | 1.52 |
| 2023 | 9,597,000 | 85,200 | 127,200 | -42,000 | 8.9 | 13.3 | -4.4 | -1.8 | 1.51 |
| 2024 | 9,580,000 |
Current vital statistics
| Period | Live births | Deaths | Natural increase |
|---|---|---|---|
| January–February 2023 | 14,127 | 22,846 | −8,719 |
| January–February 2024 | 12,855 | 22,712 | −9,857 |
| Difference | −1,272 (−9.0%) |  −134 (−0.6%) −134 (−0.6%) | −1,138 |
Structure of the population
Vital statistics by county
There are large variations in the birth rates as of 2016: Zala County has the lowest birth rate with 7.5 births per thousand inhabitants, while Szabolcs-Szatmár-Bereg County has the highest birth rate with 11.2 births per thousand inhabitants.
The death rates also differ greatly from as low as 11.3 deaths per thousand inhabitants in Pest County to as high as 15.7 deaths per thousand inhabitants in Békés County.
| Vital statistics as of 2016 | |||
|---|---|---|---|
| County | Birth rate (‰) | Death rate (‰) | Natural increase |
| Baranya | 8.0 | 13.6 | -5.6 |
| Bács-Kiskun | 9.3 | 13.6 | -4.3 |
| Békés | 8.2 | 15.7 | -7.5 |
| Borsod-Abaúj-Zemplén | 11.0 | 14.2 | -3.2 |
| Budapest | 9.2 | 12.0 | -2.9 |
| Csongrád | 8.4 | 12.9 | -4.5 |
| Fejér | 9.4 | 12.5 | -3.1 |
| Győr-Moson-Sopron | 8.9 | 11.4 | -2.4 |
| Hajdú-Bihar | 10.3 | 11.6 | -1.3 |
| Heves | 9.4 | 14.5 | -5.1 |
| Jász-Nagykun-Szolnok | 9.9 | 14.8 | -4.8 |
| Komárom-Esztergom | 9.7 | 13.4 | -3.7 |
| Nógrád | 9.1 | 15.1 | -6.0 |
| Pest | 9.8 | 11.3 | -1.5 |
| Somogy | 8.8 | 14.3 | -5.5 |
| Szabolcs-Szatmár-Bereg | 11.2 | 12.2 | -0.9 |
| Tolna | 9.0 | 13.7 | -4.7 |
| Vas | 8.3 | 13.5 | -5.2 |
| Veszprém | 8.7 | 13.5 | -4.8 |
| Zala | 7.9 | 14.0 | -6.1 |
Ethnic groups and language
| County | Hungarian | Bulgarian | Romani | Greek | Croat | Polish | German | Armenian | Romanian | Rusyn | Serbian | Slovak | Slovenian | Ukrainian |
|---|---|---|---|---|---|---|---|---|---|---|---|---|---|---|
| All | 93.5% | 0.1% | 3.2% | 0.0% | 0.3% | 0.1% | 1.9% | 0.0 | 0.4% | 0.0% | 0.1% | 0.4% | 0.0% | 0.1% |
| Budapest | 95.5% | 0.1% | 1.2% | 0.1% | 0.1% | 0.2% | 1.7% | 0.1% | 0.5% | 0.0% | 0.1% | 0.2% | 0.0% | 0.1% |
| Bács-Kiskun | 93.7% | 0.0% | 2.2% | 0.0% | 0.7% | 0.0% | 2.4% | 0.0% | 0.3% | 0.0% | 0.2% | 0.4% | 0.0% | 0.0% |
| Baranya | 86.3% | 0.1% | 4.6% | 0.0% | 1.9% | 0.1% | 6.7% | 0.0% | 0.2% | 0.0% | 0.2% | 0.0% | 0.0% | 0.0% |
| Békés | 91.9% | 0.0% | 2.7% | 0.0% | 0.0% | 0.0% | 0.9% | 0.0% | 1.7% | 0.0% | 0.1% | 2.5% | 0.0% | 0.0% |
| Borsod-Abaúj-Zemplén | 90.0% | 0.0% | 8.5% | 0.0% | 0.0% | 0.1% | 0.6% | 0.0% | 0.1% | 0.2% | 0.0% | 0.3% | 0.0% | 0.1% |
| Csongrád | 96.8% | 0.0% | 1.2% | 0.0% | 0.1% | 0.0% | 0.6% | 0.0% | 0.5% | 0.0% | 0.5% | 0.2% | 0.0% | 0.0% |
| Fejér | 96.0% | 0.0% | 1.5% | 0.1% | 0.1% | 0.1% | 1.7% | 0.0% | 0.2% | 0.0% | 0.1% | 0.1% | 0.0% | 0.1% |
| Győr-Moson-Sopron | 95.0% | 0.1% | 0.8% | 0.0% | 0.7% | 0.0% | 2.7% | 0.0% | 0.2% | 0.0% | 0.0% | 0.4% | 0.0% | 0.0% |
| Hajdú-Bihar | 95.4% | 0.1% | 3.4% | 0.0% | 0.0% | 0.0% | 0.4% | 0.0% | 0.5% | 0.0% | 0.0% | 0.0% | 0.0% | 0.1% |
| Heves | 92.6% | 0.0% | 6.3% | 0.0% | 0.0% | 0.0% | 0.5% | 0.0% | 0.2% | 0.0% | 0.0% | 0.2% | 0.0% | 0.1% |
| Jász-Nagykun-Szolnok | 94.2% | 0.0% | 4.9% | 0.0% | 0.0% | 0.0% | 0.4% | 0.0% | 0.2% | 0.0% | 0.0% | 0.0% | 0.0% | 0.0% |
| Komárom-Esztergom | 93.2% | 0.1% | 1.4% | 0.0% | 0.0% | 0.1% | 3.6% | 0.0% | 0.3% | 0.0% | 0.0% | 1.2% | 0.0% | 0.1% |
| Nógrád | 90.0% | 0.0% | 7.7% | 0.0% | 0.0% | 0.0% | 0.7% | 0.0% | 0.1% | 0.0% | 0.0% | 1.4% | 0.0% | 0.0% |
| Pest | 94.2% | 0.1% | 1.7% | 0.0% | 0.1% | 0.1% | 2.5% | 0.0% | 0.5% | 0.0% | 0.1% | 0.6% | 0.0% | 0.1% |
| Somogy | 92.1% | 0.0% | 5.3% | 0.0% | 0.5% | 0.0% | 1.7% | 0.0% | 0.1% | 0.0% | 0.0% | 0.0% | 0.0% | 0.0% |
| Szabolcs-Szatmár-Bereg | 90.8% | 0.0% | 8.0% | 0.0% | 0.0% | 0.0% | 0.5% | 0.0% | 0.2% | 0.1% | 0.0% | 0.1% | 0.0% | 0.3% |
| Tolna | 90.3% | 0.0% | 3.9% | 0.0% | 0.1% | 0.0% | 5.2% | 0.0% | 0.2% | 0.0% | 0.1% | 0.1% | 0.0% | 0.0% |
| Vas | 94.5% | 0.0% | 1.0% | 0.0% | 1.2% | 0.0% | 2.1% | 0.0% | 0.1% | 0.0% | 0.0% | 0.0% | 0.7% | 0.0% |
| Veszprém | 94.8% | 0.0% | 1.5% | 0.0% | 0.0% | 0.1% | 3.2% | 0.0% | 0.2% | 0.0% | 0.0% | 0.1% | 0.0% | 0.1% |
| Zala | 94.1% | 0.0% | 2.6% | 0.0% | 1.3% | 0.0% | 1.6% | 0.0% | 0.1% | 0.0% | 0.0% | 0.0% | 0.0% | 0.0% |
History
Hungary before the Treaty of Trianon (4 June 1920)
Hungary lost 64% of its total population in consequence of the Treaty of Trianon, decreasing from 20.9 million to 7.6 million, and 31% (3.3 out of 10.7 million) of its ethnic Hungarians, Hungary lost five of its ten most populous cities.

According to the census of 1910, the largest ethnic group in the Kingdom of Hungary were Hungarians, who were 54.5% of the population of Kingdom of Hungary, excluding Croatia-Slavonia. Although the territories of the former Kingdom of Hungary that were assigned by the treaty to neighbouring states in total had a majority of non-Hungarian population, they also included areas of Hungarian majority and significant Hungarian minorities, numbering 3,318,000 in total.
The number of Hungarians in the different areas based on census data of 1910. The present day location of each area is given in parentheses.
- In Upper Hungary (mostly Slovakia): 885,000 - 30%
- In Transylvania (Romania): 1,658,045 - 31.6%
- In Vojvodina (Serbia): 425,672 - 28.1%
- In Transcarpathia (Ukraine): 183,000 - 30%
- In Croatia: 121,000 - 3.5%
- In Prekmurje (Slovenia): 14,065 - 15%
- In Burgenland (Austria): 26,200 - 9%
Non-Hungarian population in the Kingdom of Hungary, based on 1910 census data
Romanians, Slovaks, Ruthenians, Serbs, Croats and Germans, who represented the majority of the populations of the above-mentioned territories:
- In Upper Hungary (mostly Slovakia): 1,687,977 Slovaks and 1,233,454 others (mostly Hungarians - 886,044, Germans, Ruthenians and Roma). However, according to the Czechoslovak census in 1921, there were 2,025,003 (67,5%) Slovaks, 650,597 (21,7%) Hungarians, 145,844 (4,9%) Germans, 88,970 (3,0%) Ruthenians and 90,456 (3,0%) others including Jews.
- In Carpathian Ruthenia (Ukraine): 330,010 Ruthenians and 275,932 others (mostly Hungarians, Germans, Romanians, and Slovaks)
- In Transylvania (Romania): 2,831,222 Romanians (53.8%) and 2,431,273 others (mostly Hungarians - 1,662,948 (31.6%) and Germans - 563,087 (10.7%). The 1919 and 1920 Transylvanian censuses indicate a greater percentage of Romanians (57.1%/57.3%) and a smaller Hungarian minority (26.5%/25.5%)
- In Vojvodina and Croatia-Slavonia (Serbia, Croatia): 2,756,000 Croats and Serbs and 1,366,000 others (mostly Hungarians and Germans)
- In Prekmurje (Slovenia): 74,199 Slovenes (80%), 14,065 Hungarians (15,2%), 2,540 Germans (2,7%)
- In Burgenland (Austria): 217,072 Germans and 69,858 others (mainly Croatian and Hungarian)
Post-Trianon Hungary
| Ethnic group | estimation 1495 | 1715 | 1785 | census 1880 | census 1900 | census 1910 | census 1920 | census 1930 | ||||||||
|---|---|---|---|---|---|---|---|---|---|---|---|---|---|---|---|---|
| Number | % | Number | % | Number | % | Number | % | Number | % | Number | % | Number | % | Number | % | |
| Hungarians | 990,000 | 95.6% | 1,176,000 | 79.1% | 2,103,000 | 79.0% | 4,402,364 | 82.4% | 5,890,999 | 85.9% | 6,730,299 | 88.4% | 7,155,973 | 89.6% | 8,000,335 | 92.1% |
| Germans | 17,000 | 1.6% | 136,600 | 9.2% | 291,900 | 11.0% | 606,363 | 11.3% | 604,751 | 8.8% | 553,179 | 7.3% | 550,062 | 6.9% | 477,153 | 5.5% |
| Slovaks | n.d | n.d. | 37,700 | 2.5% | 130,400 | 4.9% | 199,788 | 3.7% | 192,227 | 2.8% | 165,317 | 2.2% | 141,877 | 1.8% | 104,786 | 1.2% |
| Croats | 1,200 | 0.1% | 58,900 | 4.0% | 71,700 | 2.7% | 59,251 | 1.1% | 68,161 | 1.0% | 62,018 | 0.8% | 58,931 | 0.7% | 47,337 | 0.5% |
| Others | 23,800 | 2.4% | 70,800 | 4.8% | 66,214 | 2.4% | 75,598 | 1.5% | 98,277 | 1.5% | 101,301 | 1.3% | 80,026 | 1.0% | 55,503 | 0.6% |
| Total | 1,032,000 | 1,480,000 | 2,663,214 | 5,343,364 | 6,854,415 | 7,612,114 | 7,986,875 | 8,685,109 | ||||||||
According to the 1920 census 10.4% of the population spoke one of the minority languages as mother language:
- 551,212 German (6.9%)
- 141,882 Slovak (1.8%)
- 23,760 Romanian (0.3%)
- 36,858 Croatian (0.5%)
- 23,228 Bunjevac and Šokci (0.3%)
- 17,131 Serb (0.2%)
- 7,000 Slovenes (0,08%)
The number of bilingual people was much higher, for example 1,398,729 people spoke German (17%), 399,176 people spoke Slovak (5%), 179,928 people spoke Croatian (2.2%) and 88,828 people spoke Romanian (1.1%). Hungarian was spoken by 96% of the total population and was the mother language of 89%. The percentage and the absolute number of all non-Hungarian nationalities decreased in the next decades, although the total population of the country increased.
Note: 300.000 Hungarian refugees fled to Hungary from the territory of successor states (Romania, Czechoslovakia and Yugoslavia) after the WW I.
From 1938 to 1945


Hungary expanded its borders with territories from Czechoslovakia, Romania and Yugoslavia following the First Vienna Award (1938) and Second Vienna Award (1940). The remainder of Carpathian Ruthenia and parts of Yugoslavia were occupied and annexed in 1939 and 1941, respectively. Regarding Northern Transylvania, the Romanian census from 1930 counted 38% Hungarians and 49% Romanians, while the Hungarian census from 1941 counted 53.5% Hungarians and 39.1% Romanians. The territory of Bácska had 789,705 inhabitants, and 45,4% or 47,2% declared themselves to be Hungarian native speakers or ethnic Hungarians. The percentage of Hungarian speakers was 84% in southern Czechoslovakia and 25% in the Sub-Carpathian Rus.
| Ethnic group | census 1941 | |
|---|---|---|
| Number | % | |
| Hungarians | 11,881,455 | 80.9% |
| Romanians | 1,051,026 | 7.2% |
| Ruthenians | 547,770 | 3.7% |
| Germans | 533,045 | 3.6% |
| Serbs | 213,585 | 1.5% |
| Slovaks | 175,550 | 1.2% |
| Jewish | 139,041 | 0.9% |
| Roma | 76,209 | 0.5% |
| Croats | 12,346 | 0.1% |
| Slovenes | 9,400 | 0.1% |
| Others | 29,210 | 0.2% |
| Total | 14,679,573 | |
After WW II: 1949–1990
After World War II, about 200,000 Germans were deported to Germany according to the decree of the Potsdam Conference. Under the forced exchange of population between Czechoslovakia and Hungary, approximately 73,000 Slovaks left Hungary. After these population movements Hungary became an ethnically almost homogeneous country except the rapidly growing number of Romani people in the second half of the 20th century.
| Ethnic group | census 1949 | census 1960 | census 1970 | census 1980 | census 1990 | |||||
|---|---|---|---|---|---|---|---|---|---|---|
| Number | % | Number | % | Number | % | Number | % | Number | % | |
| Hungarians | 9,076,041 | 98.6% | 9,786,038 | 98.2% | 10,166,237 | 98.5% | 10,638,974 | 99.3% | 10,142,072 | 97.8% |
| Roma | 21,387 | 0.2% | 25,633 | 0.3% | 34,957 | 0.3% | 6,404 | 0.1% | 142,683 | 1.4% |
| Germans | 22,455 | 0.2% | 50,765 | 0.5% | 35,594 | 0.4% | 11,310 | 0.1% | 30,824 | 0.3% |
| Slovaks | 25,988 | 0.3% | 30,630 | 0.3% | 21,176 | 0.2% | 9,101 | 0.1% | 10,459 | 0.1% |
| Croats | 20,423 | 0.2% | 33,014 | 0.3% | 17,609 | 0.2% | 13,895 | 0.1% | 13,570 | 0.1% |
| Romanians | 14,713 | 0.2% | 15,787 | 0.2% | 12,624 | 0.1% | 8,874 | 0.1% | 10,740 | 0.1% |
| Serbs | 5,158 | 0.1% | 4,583 | 0.1% | 12,235 | 0.1% | 2,805 | 0.0% | 2,905 | 0.0% |
| Slovenes | 4,473 | 0.1% | - | 4,205 | 0.0% | 1,731 | 0.0% | 1,930 | 0.0% | |
| Others | 14,161 | 0.1% | 14,534 | 0.1% | 17,462 | 0.2% | 16,369 | 0.2% | 19,640 | 0.2% |
| Total | 9,204,799 | 9,961,044 | 10,322,099 | 10,709,463 | 10,374,823 | |||||
For historical reasons, significant Hungarian minority populations can be found in the surrounding countries, notably in Ukraine (in Transcarpathia), Slovakia, Romania (in Transylvania), and Serbia (in Vojvodina). Austria (in Burgenland), Croatia, and Slovenia (Prekmurje) are also host to a number of ethnic Hungarians.
2001–2022
| Ethnic group | census 2001 | census 2011 | census 2022 | |||
|---|---|---|---|---|---|---|
| Number | % | Number | % | Number | % | |
| Hungarians | 9,416,045 | 92.3% | 8,504,492 | 85.6% | 8,438,129 | 87.9% |
| Roma | 189,984 | 2.0% | 315,583 | 3.2% | 209,909 | 2.2% |
| Germans | 62,105 | 0.6% | 185,696 | 1.9% | 142,551 | 1.5% |
| Romanians | 7,995 | 0.1% | 35,641 | 0.4% | 27,554 | 0.3% |
| Slovaks | 17,693 | 0.2% | 35,208 | 0.4% | 29,881 | 0.3% |
| Croats | 15,597 | 0.2% | 26,774 | 0.3% | 21,824 | 0.2% |
| Serbs | 3,816 | 0.0% | 10,038 | 0.1% | 11,622 | 0.1% |
| Slovenes | 3,025 | 0.0% | 2,820 | 0.0% | 3,965 | 0.0% |
| Others | 57,059 | 0.6% | 73,399 | 0.9% | 55,610 | 0.6% |
| Not stated | 570,537 | 5.6% | 1,398,731 | 14.1% | 1,086,239 | 11.3% |
| Total | 10,198,315 | 9,937,628 | 9,603,634 | |||
- Note: In 2001 570,537, in 2011 1,398,731 people did not give answer for ethnicity. Moreover, people were able to give more than one answer on the question asking for the minorities (for example, people were allowed to write Hungarian as their first ethnic identity and German as an ethnic identity being influenced by), hence the sum of the above exceeds the number of population.
- Methodology had changed in 2001 and 2011 also.
- Roma people is estimated to be around 8.8% Roma
Historical ethnic groups of Hungary


When the Hungarians invaded the Carpathian Basin, it was inhabited by Slavic and Avar peoples. Written sources from the 9th century also suggest that some groups of Onogurs and Bulgars occupied the valley of the river Mureș at the time of the Magyars’ invasion. There is a dispute as to whether Romanian population existed in Transylvania during that time.
The Roma minority
The first Romani groups arrived in Hungary in the fifteenth century from Turkey. Nowadays, the real number of Roma in Hungary is a disputed question.
In the 2001 census only 190 046 (2%) called themselves Roma, but experts and Roma organisations estimate that there are between 450,000 and 1,000,000 Roma living in Hungary. Since then, the size of the Roma population has increased rapidly. Today every fifth or sixth newborn child belongs to the Roma minority. Based on current demographic trends, a 2006 estimate by Central European Management Intelligence claims that the proportion of the Roma population will double by 2050, putting the percentage of its Roma community at around 14-15% of the country's population.
There are problems related to the Roma minority in Hungary, and the very subject is a heated and disputed topic.
Objective problems:
- Slightly more than 80% of Roma children complete primary education, but only one third continue studies into the intermediate (secondary) level. This is far lower than the more than 90% proportion of children of non-Roma families who continue studies at an intermediate level. Less than 1% of Roma hold higher educational certificates.
- Poverty: most of the Roma people live in significantly worse conditions than others.
- Bad health conditions: life expectancy is about 10 years less compared to non-Romas
-
 Population pyramid of Budapest (99.2% non-Romany inhabitants), see: Demographics of Budapest
 -
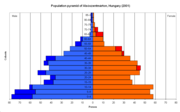 Population pyramid of Alsószentmárton (100% Romany inhabitants)


Kabars
Three Kabar tribes joined to the Hungarians and participated in the Hungarian conquest of Hungary. They settled mostly in Bihar county.
Böszörménys
The Muslim Böszörménys migrated to the Carpathian Basin in the course of the 10th-12th centuries and they were composed of various ethnic groups. Most of them must have arrived from Volga Bulgaria and Khwarezm.
Pechenegs
Communities of Pechenegs (Besenyő in Hungarian) lived in the Kingdom of Hungary from the 11-12th centuries. They were most numerous in the county of Tolna.
Oghuz Turks (Ouzes)
Smaller groups of Oghuz Turk settlers ('Úzok' or 'Fekete Kunok/Black Cumans' in Hungarian) came to the Carphatian Basin from the middle of the 11th century. They were settled mostly in Barcaság. The city of Ózd got its name after them.
Jassics
The Jassic (Jász in Hungarian) people were a nomadic tribe which settled -with the Cumans- in the Kingdom of Hungary during the 13th century. Their name is almost certainly related to that of the Iazyges. Béla IV, king of Hungary granted them asylum and they became a privileged community with the right of self-government. During the centuries they were fully assimilated to the Hungarian population, their language disappeared, but they preserved their Jassic identity and their regional autonomy until 1876. Over a dozen settlements in Central Hungary (e.g. Jászberény, Jászárokszállás, Jászfényszaru) still bear their name.
Cumans
During the Russian campaign, the Mongols drove some 200,000 Cumans, a nomadic tribe who had opposed them, west of the Carpathian Mountains. There, the Cumans appealed to King Béla IV of Hungary for protection. In the Kingdom of Hungary, Cumans created two regions named Cumania (Kunság in Hungarian): Greater Cumania (Nagykunság) and Little Cumania (Kiskunság), both located the Great Hungarian Plain. Here, the Cumans maintained their autonomy, language and some ethnic customs well into the modern era. According to Pálóczi's estimation originally 70–80,000 Cumans settled in Hungary.
Romanians
The oldest extant documents from Transylvania make reference to Vlachs too. Regardless of the subject of Romanian presence/non-presence in Transylvania prior to the Hungarian conquest, the first chronicles to write of Vlachs in the intra-Carpathian regions is the Gesta Hungarorum, while the first written Hungarian sources about Romanian settlements derive from the 13th century, record was written about Olahteluk village in Bihar County from 1283. The 'land of Romanians', Terram Blacorum (1222, 1280) showed up in Fogaras and this area was mentioned under different name (Olachi) in 1285. The first appearance of a probably Romanian name 'Ola' in Hungary derives from a charter (1258).
They were a significant population in Transylvania, Banat, Maramureș and Partium (Crișana). There are different estimations in connection with number of Romanians in Kingdom of Hungary. According to a research based on place-names made by István Kniezsa, 511 villages of Transylvania and Banat appear in documents at the end of the 13th century, however only 3 of them bore Romanian names, and around 1400 AD, Transylvania and Banat consisted of 1757 villages, though only 76 (4.3%) of them had names of Romanian origin. The number of Romanians started to increase significantly from the Early modern period, and by 1700 the Romanian ethnic group consisted of 40 percent of the Transylvanian population and their number raised even more in the 18th century. Although, in 1574, Pierre Lescalopier, relating his voyage from Venice to Constantinople, claimed that most of the inhabitants of Transylvania were Romanians and according to other estimates, the Romanian inhabitants who were primarily peasants, consisted of more than 60 percent of the population in 1600. Jean W. Sedlar estimates that Vlachs (Romanians) constituted about two-thirds of Transylvania's population in 1241 on the eve of the Mongol invasion, however according to Károly Kocsis and Eszter Kocsisné Hodosi the Hungarian ethnic group in Transylvania was in decent majority before Battle of Mohács and only lost its relative majority by the 17th century. Nevertheless, Grigore Ureche in Letopisețul Țării Moldovei (1642 - 1647) noticed that in Transylvania Romanians were more numerous than Hungarians. Official censuses with information on Hungary's ethnic composition have been conducted since the 19th century.
In 1881, Romanian-majority settlements projected to the present-day territory of Hungary were: Bedő, Csengerújfalu, Kétegyháza, Körösszakál, Magyarcsanád, Méhkerék, Mezőpeterd, Pusztaottlaka and Vekerd. Important communities lived in the villages of Battonya, Elek, Körösszegapáti, Létavértes, Nyíradony, Pocsaj, Sarkadkeresztúr, Zsáka and in the town of Gyula.
Slovaks
The Slovak people lived mainly in Upper Hungary, northern parts of the Kingdom of Hungary. Due to post-Ottoman resettlements, the regions of Vojvodina, Banat and Békés county received bigger Slovak communities in the 18th century, which revitalized many deserted villages and towns, such as Békéscsaba, where Slovaks became the biggest ethnic group, or Nyíregyháza, where they comprised more than a third of the population in 1881. After WWII a major population exchange with Czechoslovakia was carried out: 71,787 or 73,200 Slovaks from Hungary were transferred to Slovakia – the exact number depends on source consulted – were resettled in South Slovakia in exchange for, according to different estimations, 45,000 or 120,000 Hungarians.
Serbs
From the 14th century, escaping from the Ottoman threat, a large number of Serbs migrated to the Hungarian Kingdom. After the Battle of Mohács, most of the territory of Hungary got into Ottoman rule. In that time, especially in the 17th century, many Serb, and other Southern Slavic immigrants settled in Hungary. Most of the Ottoman soldiers in the territory of present-day Hungary were South Slavs (the Janissary). After the Turkish withdrawal, Kingdom of Hungary came under Habsburg rule, a new wave of Serb refugees migrated to the area around 1690, as a consequence of the Habsburg-Ottoman war. In the first half of the 18th century, Serbs and South Slavs were ethnic majority in several cities in Hungary.
Germans
Three waves of German migration can be distinguished in Hungary before the 20th century. The first two waves settled in Upper Hungary and in Southern Transylvania (Transylvanian Saxons), with the first being in the 11th century and the second in the 13th century.
The third, largest wave of German-speaking immigrants into Hungary occurred after the withdrawal of the Ottoman Empire from Hungarian territory, after the Treaty of Karlowitz. Between 1711 and 1780, German-speaking settlers immigrated to the regions of Southern Hungary, mostly region of Bánát, Bács-Bodrog, Baranya and Tolna counties (as well as into present-day Romania and Yugoslavia), which had been depopulated by the Ottoman wars. At the end of the 18th century, the Kingdom of Hungary contained over one million German-speaking residents (collectively known as Danube Swabians). In 2011, 131,951 people declared to be German in Hungary (1,6%).
Rusyns
Rusyns had lived mostly in Carpathian Ruthenia, Northeast Hungary, however significant Rusyn population appeared in Vojvodina from the 18th century.
Croats
Croatia was in personal union with Hungary from 1102. Croat communities were spread mostly in the western and southern part of the country and along the Danube, including Budapest.
Poles
The Poles lived at the northern borders of Kingdom of Hungary from the arrival of the Hungarians.
Slovenes
The Slovenes (Vendek in Hungarian) lived in the western part of the Carpathian basin before the Hungarian conquest. In the 11th and 12th century, the current linguistic and ethnic border between the Hungarian and Slovene people was established. Nowadays, they live in Vendvidék (Slovenska krajina in Slovenians) between the Mura and the Rába rivers. In 2001, there were around 5,000 Slovenes in Hungary.
Jews
The first historical document about Jews of Hungary is the letter written about 960 to King Joseph of the Khazars by Hasdai ibn Shaprut, the Jewish statesman of Córdoba, in which he says Jews living in "the country of Hungarin". There are Jewish inscriptions on tombs and monuments in Pannonia (Roman Hungary) dated to the second or third century CE.
Armenians
The first Armenians came to Hungary from the Balkans in the 10 - 11th century.
Greeks
Greeks migrated to Kingdom of Hungary from the 15th and 16th centuries. Mass migrations did not occur until the 17th century, the largest waves being in 1718 and 1760–1770; they were primarily connected to the economic conditions of the period. It is estimated that 10,000 Greeks emigrated to Hungary in the second half of the 18th century. A number of Greeks Communists escaped to Hungary after the Greek Civil War, notably in the 'Greek' village of Beloiannisz.
Bulgarians
The town of Szentendre and the surrounding villages were inhabited by Bulgarians since the Middle Ages. However, present day Bulgarians are largely descended from gardeners who migrated to Hungary from the 18th century.
Religion
| Denominations | Population | % of total |
|---|---|---|
| Catholicism | 2,886,619 | 30 |
| Roman Catholics | 2,643,855 | 28.3 |
| Greek Catholics | 165,135 | 1.7 |
| Protestantism | 1,120,485 | 11.6 |
| Calvinists | 943,982 | 9.8 |
| Lutherans | 176,503 | 1.8 |
| Orthodox Christianity | 15,578 | 0.2 |
| Judaism | 7,635 | 0.1 |
| Other religions | 171,174 | 1.8 |
| Total religions | 4,201,491 | 43.7 |
| No religion | 1,549,610 | 16.2 |
| Did not wish to answer | 3,852,533 | 40.1 |
| total | 9,603,634 | 100.00 |
The majority of Hungarians became Christian in the 11th century. Hungary remained predominantly Catholic until the 16th century, when the Reformation led to the first Lutherans, and later Calvinists, which were embraced by nearly the entire Hungarian population at the time.
In the second half of the 16th century, Jesuits led a successful campaign of counterreformation among the Hungarians, although Protestantism survived as the faith of a significant minority, especially in the far east and northeast of the country. Orthodox Christianity in Hungary has been the religion mainly of some national minorities in the country, notably Romanians, Rusyns, Ukrainians, and Serbs.
Faith Church, one of Europe's largest Pentecostal churches, is also located in Hungary. Hungary has historically been home to a significant Jewish community.

According to 2011 census data, Christianity is the largest religion in Hungary, with around 5.2 million adherents (52.9%), while the largest denomination in Hungary is the Catholic Church (38.9% — Latin Church 37.1%; Hungarian Greek Catholic Church 1.8%). There is a significant Calvinist minority (11.6% of the population) and smaller Lutheran (2.2%), Orthodox (0.1%) and Jewish (0.1%) minorities. However, these census figures are representative of religious affiliation rather than attendance; around 12% of Hungarians attend religious services more than least once a week and around 50% more than once a year, while 30% of Hungarians do not believe in God at all. The census showed a large drop of religious adherents who wish to answer, from 74.6% to 54.7% in ten years' time, replacing them by people either who do not wish to answer or people who are not following a religion.
Immigration
Foreign citizenship population
| Country | 2017 | 2018 | 2019 | 2020 | 2021 | 2022 | 2023 |
|---|---|---|---|---|---|---|---|
 Ukraine Ukraine | 5,774 | 10,503 | 24,197 | 30,316 | 27,380 | 30,707 | 36,017 |
  Germany Germany | 18,627 | 17,879 | 16,537 | 18,344 | 17,490 | 19,747 | 22,310 |
 China China | 19,111 | 19,905 | 18,851 | 19,655 | 18,558 | 17,685 | 18,192 |
 Romania Romania | 24,040 | 22,747 | 21,017 | 22,162 | 18,220 | 16,601 | 16,542 |
 Slovakia Slovakia | 9,519 | 9,652 | 9,563 | 10,582 | 14,677 | 16,040 | 16,744 |
 Vietnam Vietnam | 3,256 | 3,698 | 4,669 | 5,719 | 6,719 | 6,376 | 7,150 |
 Russia Russia | 4,902 | 4,790 | 5,088 | 5,264 | 5,035 | 4,980 | 6,193 |
 Austria Austria | 4,021 | 3,743 | 3,142 | 3,318 | 4,132 | 4,637 | 4,922 |
 Italy Italy | 3,353 | 3,576 | 3,635 | 4,038 | 3,662 | 3,717 | 3,881 |
 Serbia Serbia | 2,312 | 3,356 | 5,342 | 4,989 | 3,471 | 3,518 | 3,988 |
 Turkey Turkey | 2,063 | 2,327 | 2,785 | 3,233 | 3,217 | 3,461 | 3,917 |
 United Kingdom United Kingdom | 3,081 | 3,190 | 3,105 | 3,540 | 3,373 | 3,323 | 3,392 |
 Netherlands Netherlands | 2,814 | 2,877 | 2,834 | 3,158 | 3,065 | 3,299 | 3,652 |
 United States United States | 3,198 | 3,373 | 3,387 | 3,501 | 2,977 | 3,051 | 3,069 |
 France France | 2,523 | 2,633 | 2,593 | 2,833 | 2,602 | 2,754 | 2,933 |
 Mongolia Mongolia | 838 | 917 | 1,470 | 1,834 | 1,845 | 1,854 | 2,692 |
 Poland Poland | 2,061 | 1,928 | 1,960 | 2,145 | 2,017 | 2,038 | 2,063 |
 Syria Syria | 1,519 | 1,987 | 2,139 | 2,195 | 2,277 | 1,889 | 1,941 |
| Total | 151,132 | 161,809 | 180,773 | 199,957 | 194,491 | 202,525 | 226,267 |
| Continent | 2017 population | % of total | 2018 population | % of total | 2019 population | % of total | 2020 population | % of total | 2021 population | % of total | 2022 population | % of total | 2023 population | % of total |
|---|---|---|---|---|---|---|---|---|---|---|---|---|---|---|
| Europe | 99,194 | 65.63 | 104,254 | 64.43 | 117,552 | 65.03 | 131,291 | 65.66 | 124,422 | 63.97 | 131,431 | 64.90 | 144,102 | 63.60 |
| Asia | 39,937 | 26.42 | 44,692 | 27.62 | 49,056 | 27.14 | 53,099 | 26.56 | 54,730 | 28.14 | 55,000 | 27.16 | 64,945 | 28.7 |
| America | 5,397 | 3.57 | 5,891 | 3.64 | 6,850 | 3.79 | 7,631 | 3.82 | 6,933 | 3.56 | 7,454 | 3.68 | 7,591 | 3.35 |
| Africa | 5,985 | 3.96 | 6,334 | 3.91 | 6,660 | 3.68 | 7,278 | 3.64 | 7,748 | 3.98 | 8,028 | 3.96 | 9,041 | 4.00 |
| Other and unknown | 619 | 0.41 | 638 | 0.39 | 655 | 0.36 | 658 | 0.33 | 658 | 0.34 | 612 | 0.30 | 588 | 0.26 |
Largest cities
| Name | Population (1949) | Population (1990) | Population (2011) | Population (2022) | Agglomeration | Status |
|---|---|---|---|---|---|---|
 Budapest Budapest | 1,590,316 | 2,016,681 | 1,729,040 | 1,682,426 | 3,310,786 (2022) | Capital city |
 Debrecen Debrecen | 115,399 | 212,235 | 211,320 | 199,520 | 281,432 (2022) | Regional centre, county seat, urban county |
 Szeged Szeged | 104,867 | 169,930 | 168,048 | 158,022 | 197,245 (2022) | Regional centre, county seat, urban county |
 Miskolc Miskolc | 109,841 | 196,442 | 167,754 | 145,735 | 231,034 (2022) | Regional centre, county seat, urban county |
 Pécs Pécs | 89,470 | 170,039 | 156,049 | 139,647 | 181,342 (2022) | Regional centre, county seat, urban county |
 Győr Győr | 69,583 | 129,331 | 129,527 | 128,050 | 275,574 (2022) | Regional centre, county seat, urban county |
 Nyíregyháza Nyíregyháza | 56,334 | 114,152 | 119,746 | 116,439 | 175,211 (2022) | County seat, urban county |
 Kecskemét Kecskemét | 61,730 | 102,516 | 111,411 | 108,334 | 180,023 (2022) | County seat, urban county |
 Székesfehérvár Székesfehérvár | 42,260 | 108,958 | 100,570 | 94,906 | - | Regional centre, county seat, urban county |
See also

Notes
Sources
- Taylor, A.J.P. (1948). The Habsburg Monarchy 1809–1918 – A History of the Austrian Empire and Austria-Hungary. London: Hamish Hamilton.
References
External links
- KSH, vital statistics, 1960-2012
- Hungarian Central Statistical Office (in English) Archived 2010-04-09 at the Wayback Machine
This article uses material from the Wikipedia English article Demographics of Hungary, which is released under the Creative Commons Attribution-ShareAlike 3.0 license ("CC BY-SA 3.0"); additional terms may apply (view authors). Content is available under CC BY-SA 4.0 unless otherwise noted. Images, videos and audio are available under their respective licenses.
®Wikipedia is a registered trademark of the Wiki Foundation, Inc. Wiki English (DUHOCTRUNGQUOC.VN) is an independent company and has no affiliation with Wiki Foundation.