Demographics Of Crimea
As of January 2021, the estimated total population of the Republic of Crimea and Sevastopol was at 2,416,856 (Republic of Crimea: 1,903,707, Sevastopol: 513,149).
This is up from the 2001 Ukrainian Census figure, which was 2,376,000 (Autonomous Republic of Crimea: 2,033,700, Sevastopol: 342,451), and the local census conducted by Russia in December 2014, which found 2,248,400 people (Republic of Crimea: 1,889,485, Sevastopol: 395,000).
History

The Crimean interior has been ethnically diverse throughout its recorded history, changing hands numerous times, while the south coast was held continuously for most of the last two millennia by various Roman (and Eastern Roman) states. The interior was dominated by a succession of Scytho-Sarmatian, Gothic, Hunnic, Turkic, Mongol and Slavic conquests. Its south coast was Greek speaking first as Greek colonies (7th or 6th century BC and following), then under the Bosporan Kingdom (480 BC - 63 BC), Romans (47 BC -330 AD) and their successor states, the Byzantine Empire (330 AD - 1204 AD), the Empire of Trebizond (1204 AD - 1461 AD), and the independent Principality of Theodoro (1461 AD - 1475 AD). In 1475 the region was conquered by the Ottoman Turks. During the late Middle Ages a few coastal cities were ruled by Italian city states. A number of Englishmen, fleeing England after the Norman Conquest, were said to have settled in Crimea with the Byzantine Emperor’s permission, and comprised a majority of his Varangian Guard until the Empire’s collapse.
The Crimean Tatars emerged as a Turkic-speaking ethnic group native to Crimea in the early modern period, during the lifetime of the Crimean Khanate, and by the annexation of the Crimean Khanate by the Russian Empire in 1783, they formed the clear majority of Crimean population. The colonization "New Russia" (the Novorossiysk Governorate, of which the later Taurida Governorate formed a part) at the end of the 18th century was led by Prince Grigori Potemkin who was granted the powers of an absolute ruler over the area by Catherine the Great. The lands were generously given to the Russian dvoryanstvo (nobility), and the enserfed peasantry mostly from Ukraine and fewer from Russia were transferred to cultivate what was a sparsely populated steppe. Catherine the Great also invited European settlers to these newly conquered lands: Crimea Germans, Poles in Russia, Italians of Crimea, and others. Crimea is geographically and demographically divided into three regions, the steppe interior, the mountains, and the coast. The Tatars were the predominant portion of the population in the mountainous area and about half of the steppe population, while Russians were concentrated most heavily in the Feodosiya district. Germans and settled in the Crimea at the beginning of the 19th century, receiving a large allotment and fertile land. Wealthy colonists later bought substantial portions of land, mainly in Perekopsky and Yevpatoria districts.
By the 1897 Russian Empire Census, Crimean Tatars continued to form a slight plurality (35%) of Crimea's still largely rural population, but there were large numbers of Russians (33%) and Ukrainians (11%), as well as smaller numbers of Germans, Jews (including Krymchaks and Crimean Karaites), Bulgarians, Belarusians, Turks, Armenians, Greeks and Roma (gypsies).
The upheavals and ethnic cleansing of the 20th century vastly changed Crimea's ethnic composition. In 1944, 200,000 Crimean Tatars were deported from Crimea to Central Asia and Siberia, along with 70,000 Greeks and 14,000 Bulgarians and other nationalities.[why?] By the latter 20th century, Russians and Ukrainians made up almost the entire population. However, with the fall of the Soviet Union, exiled Crimean Tatars began returning to their homeland and accounted for 10% of the population by the beginning of the 21st century.
Ethnicities and languages
Crimean Gothic, an East Germanic language, became extinct around the 18th century, while the Crimean Goths diffused into other ethnicities much earlier on. Old English was also spoken by settlers from England, who were eventually absorbed into the Tatar population. According to Ukraine's 2001 census, the ethnic makeup of Crimea's population consisted primarily of the following self-reported groups: Russians (1.492 million, 67.9%), Ukrainians (344,515; 15.7%), Crimean Tatars (245,000; 12.6%), Belarusians (35,000; 1.4%), other Tatars (13,500; 0.5%), Armenians (10,000; 0.4%), and Jews (5,500; 0.2%).
| Ethnic group | 1785 census | 1795 census | 1816 census | 1835 census | 1850 census | 1864 census | 1897 census | 1926 census | 1939 census | 1959 census | 1970 census | 1979 census | 1989 census | 2001 census1 | 2014 census2 | 2021 census | ||||||||||
|---|---|---|---|---|---|---|---|---|---|---|---|---|---|---|---|---|---|---|---|---|---|---|---|---|---|---|
| % | % | % | % | % | % | Number | % | Number | % | Number | % | Number | % | Number | % | Number | % | Number | % | Number | % | Number | % | Number | % | |
| Russians | 2.2% | 4.3% | 4.8% | 4.4% | 6.6% | 28.5% | 180,963 | 33.11% | 301,398 | 42.2% | 558,481 | 49.6% | 858,273 | 71.4% | 1,220,484 | 67.3% | 1,460,980 | 66.9% | 1,629,542 | 67.0% | 1,450,400 | 60.4% | 1,492,078 | 67.9% | 1,706,662 | 76.4% |
| Crimean Tatars (+ Tatars) | 84.1% | 87.6% | 85.9% | 83.5% | 77.8% | 50.3% | 194,294 | 35.55% | 179,094 | 25.1% | 218,879 | 19.4% | 5,422 | 0.2% | 38,365 | 1.6% | 258,700 | 10.8% | 277,336 | 12.6% | 284,522 | 12.7% | ||||
| Ukrainians | 1.3% | 3.6% | 3.1% | 7% | 64,703 | 11.84% | 77,405 | 10.6% | 154,123 | 13.7% | 267,659 | 22.3% | 480,733 | 26.5% | 547,336 | 25.1% | 625,919 | 25.8% | 576,600 | 24.0% | 344,515 | 15.7% | 171,160 | 7.7% | ||
| Belarusians | 2,058 | 0.38% | 3,842 | 0.5% | 6,726 | 0.6% | 21,672 | 1.8% | 39,793 | 2.2% | 45,000 (e) | 2.1% | 50,045 | 2.1% | 35,000 | 1.5% | 21,694 | 1.0% | 10,599 | 0.5% | ||||||
| Armenians | .6% | 1.3% | 1.5% | 1% | 6.5% | 8,317 | 1.52% | 10,713 | 1.5% | 12,923 | 1.1% | 3,091 | 0.2% | 2,794 | 0.1% | 10,000 | 0.4% | 11,030 | 0.5% | 9,016 | 0.4% | |||||
| Jews (+ Karaites) | 2.3% | 2.3% | 2% | 2.2% | 7% | 24,168 | 4.42% | 45,926 | 6.4% | 65,452 | 5.8% | 26,374 | 2.2% | 25,614 | 1.4% | 17,371 | 0.7% | 5,500 | 0.2% | 3,144 | 0.1% | 2,455 | 0.1% | |||
| Others | 13.7% | 3.9% | 2.1% | 5.5% | 5.4% | 7.7% | 72,089 | 13.19% | 48,257 | 2.2% | ||||||||||||||||
| Total population | 546,592 | 713,823 | 1,126,429 | 1,201,517 | 1,813,502 | 2,184,000 | 2,430,495 | 2,401,200 | 2,284,769 | 2,482,450 | ||||||||||||||||
| 1. For comparison with prior censuses the results of the Autonomous Republic of Crimea and Sevastopol were combined 2. The 2014 percentage is based on total number responding to the question on nationality (not total population). Census breakdown is Crimean Tatars 232,340 (10.6%), Tatars 44,996 (2.1%). 3. The Russian percentage in the 1864 census includes Ukrainians. | ||||||||||||||||||||||||||


Other minorities are Black Sea Germans, Roma, Bulgarians, Poles, Azerbaijanis, Koreans, Greeks and Italians of Crimea. The number of Crimea Germans was 45,000 in 1941. In 1944, 70,000 Greeks and 14,000 Bulgarians from the Crimea were deported to Central Asia and Siberia, along with 200,000 Crimean Tatars and other nationalities.
According to the 2001 census, 77% of Crimean inhabitants named Russian as their native language, 11.4% – Crimean Tatar, and 10.1% – Ukrainian. Of the Ukrainians in Crimea, 40% gave Ukrainian as their native language, with 60% identifying as ethnic Ukrainians while giving Russian as their primary language. 93% of Crimean Tatars gave Crimean Tatar as their native language, 6% were Russophone. In 2013, however, the Crimean Tatar language was estimated to be on the brink of extinction, being taught in Crimea only in around 15 schools at that point of time. Turkey has provided the greatest support to Ukraine, which has been unable to resolve the problem of education in the mother tongue in Crimea, by bringing the schools to a modern state. Ukrainian was until 2014 the single official state language countrywide, but in Crimea government business was carried out mainly in Russian. Attempts to expand the usage of Ukrainian in education and government affairs have been less successful in Crimea than in other areas of the nation.
Currently two thirds of migrants into Crimea are from other regions of Ukraine; every fifth migrant is from elsewhere in the former Soviet Union and every 40th from outside of it. Three quarters of those leaving Crimea move to other areas in Ukraine. Every 20th migrates to the West.
The number of Crimean residents who consider Ukraine their motherland increased sharply from 32% to 71.3% from 2008 through 2011; according to a poll by Razumkov Center in March 2011, although this is the lowest number in all Ukraine (93% on average across the country). Surveys of regional identities in Ukraine have shown that around 30% of Crimean residents claim to have retained a self-identified "Soviet identity".
Since the independence of Ukraine in 1991, 3.8 million former citizens of Russia have applied for Ukrainian citizenship.
In 2014 after Russian annexation of Crimea new authorities conducted a census. According to the census result the population of the Crimean Federal District is 2.2844 million people. The ethnic composition is as follows: Russians: 1.49 million (65.3%), Ukrainians: 0.35 million (15.1%), Crimean Tatars: 0.24 million (12.0%). Official Ukrainian authorities and Mejlis of the Crimean Tatar People claimed doubts that the results of population census in Crimea represent the facts.
A survey in May 2013, asked respondents what language they spoke at home:
- 82% Russian
- 10% Crimean Tatar
- 3% Russian and Ukrainian equally
- 3% Russian and another language equally
- 2% Ukrainian
Note that the proportion of people in the survey who gave their ethnicity as Ukrainian was 20%, Crimean Tatar 15%.
Birth rate, death rate, total fertility rate, life expectancy
- Vital statistics for 2015
- Births: 29 422 (12.8 per 1000)
- Deaths: 35 151 (15.3 per 1000)
- Vital statistics for 2020
- Births: 31 105 (13.6 per 1000)
- Deaths: 29 890 (13.3 per 1000)
- Fertility rate
| 2014 | 2015 | 2020 | ||||
|---|---|---|---|---|---|---|
| Republic of Crimea | 1.82 | 1.82 | 1.82 | |||
| Sevastopol | 1.65 | 1.82 | 1.82 | |||
| Crimean Federal District | 1.79 | 1.82 | 1.82 |
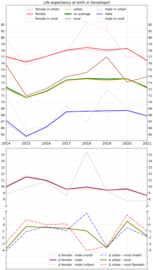
- Life expectancy
Life expectancy at birth for Crimea as a whole, calculated as weighted average between the Republic of Crimea and the federal city of Sevastopol, according to number of population.
| 2019 | 2021 | |
|---|---|---|
| Average: | 72.9 years | 70.2 years |
| Male: | 67.9 years | 65.9 years |
| Female: | 77.5 years | 74.5 years |
-
 Life expectancy in Crimea
 -
 Life expectancy with calculated differences
 -
 Life expectancy in the Republic of Crimea
 -
 Life expectancy in Sevastopol
 -
 Life expectancy in Crimea and neighboring regions of the country


Education
The 2001 Ukrainian census for the Autonomous Republic of Crimea cites the following figures for the population of "able-to-work age" (men 16–59 years, women 16–54 years):
- total population 1,203,789
- completed higher education: 175,838 (14.6%)
- higher education (partial or complete): 476,793 (39.6%)
- completed secondary education: 507,881 (49.7%)
- secondary education (partial or complete): 685,855 (57.0%)
- no primary education: 1,945 (0.16%)
- illiterate: 1,413 (0.11%)
Religion
The Crimean peninsula was Christianised at an early time, via Gothic Christianity, in the 4th century. In the 9th century, the Goths in Crimea turned to the Greek Orthodox Church, under the Metropolitanate of Gothia. In 988, Prince Vladimir I of Kyiv also captured the Byzantine town of Chersonesos (presently part of Sevastopol) where he later converted to Christianity. Christianity was mostly swept away by the Mongol invasion of Rus' in the 1230s. Islam becomes the state religion of the Golden Horde in the early 14th century. The first mosque in Crimea was built by Ozbeg Khan in Eski Qırım in 1314. Christianity returned with the annexation of the Crimean Khanate by the Eastern Orthodox Russian Empire in 1783.
A survey of residents of the Autonomous Republic of Crimea in May 2013 found that:
- 58% Orthodox
- 15% Muslim
- 13% Do not know, or not applicable
- 10% believed in God but did not belong to any religion
- 2% Atheist
- 2% Other
The proportion of the population in the survey who were Crimean Tatar was 15%.
Respondents to the same survey said that they attended a religious service:
- 3% Several times a week
- 7% Weekly
- 10% Monthly
- 37% Several times a year
- 43% Never
References
This article uses material from the Wikipedia English article Demographics of Crimea, which is released under the Creative Commons Attribution-ShareAlike 3.0 license ("CC BY-SA 3.0"); additional terms may apply (view authors). Content is available under CC BY-SA 4.0 unless otherwise noted. Images, videos and audio are available under their respective licenses.
®Wikipedia is a registered trademark of the Wiki Foundation, Inc. Wiki English (DUHOCTRUNGQUOC.VN) is an independent company and has no affiliation with Wiki Foundation.