File:Kartogram ludnosci Polski.svg
Jump to navigation
Jump to search

Size of this PNG preview of this SVG file: 774 × 600 pixels. Other resolutions: 310 × 240 pixels | 619 × 480 pixels | 991 × 768 pixels | 1,280 × 992 pixels | 2,560 × 1,984 pixels | 1,178 × 913 pixels.
Original file (SVG file, nominally 1,178 × 913 pixels, file size: 665 KB)
Captions
Captions
Add a one-line explanation of what this file represents
Summary[edit]
| Description |
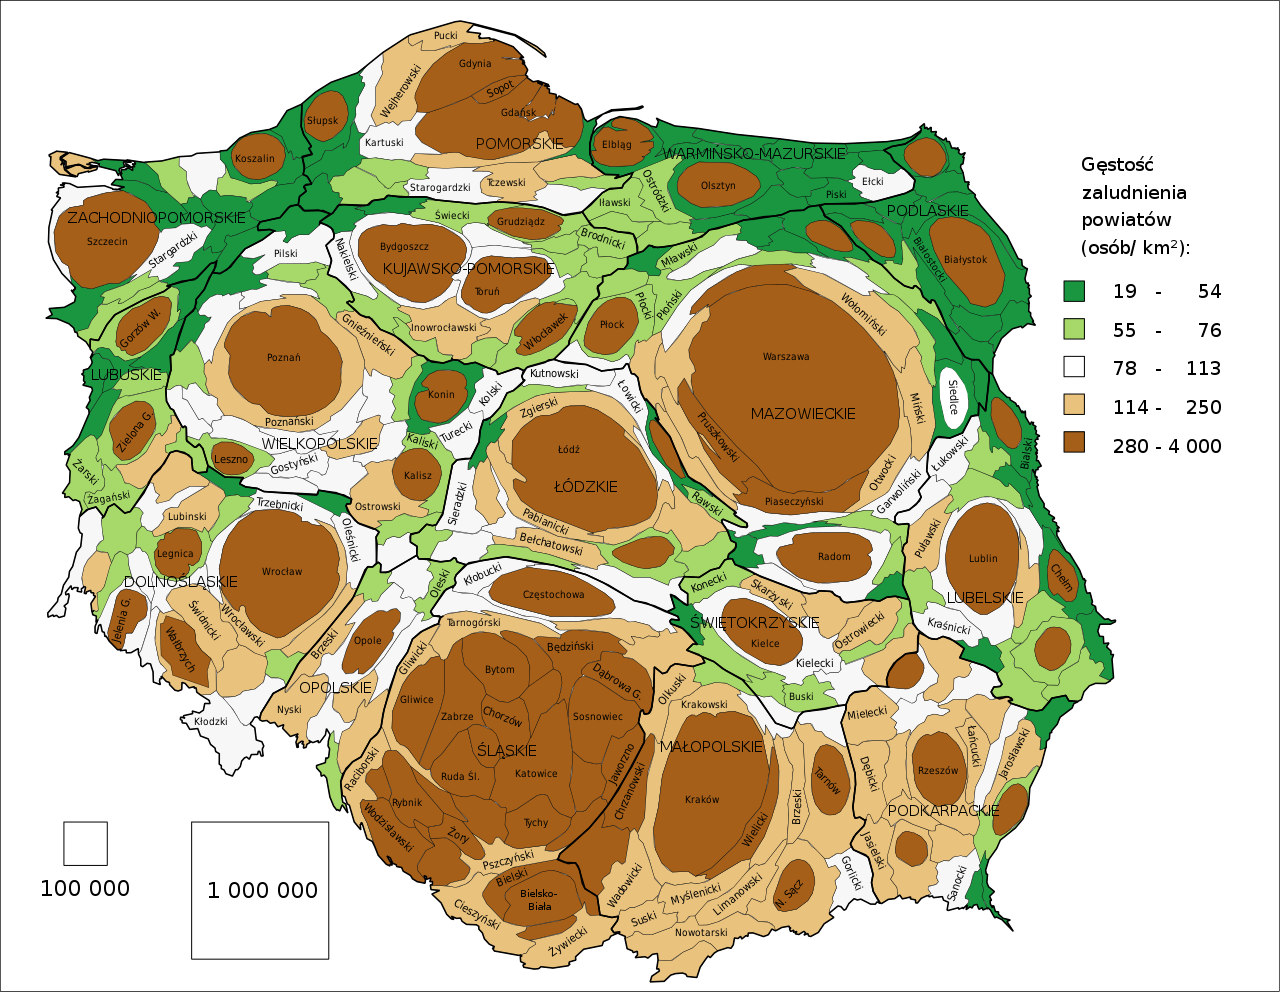
Polski: Liczba mieszkańców powiatów. Wielkość powiatu pokazuje liczbę jego mieszkańców, z pewnym przybliżeniem. Każdy kolor to 1/5 całkowitej liczby powiatów uporządkowanych według gęstości zaludnienia tworząc skalę: bardzo mała - mała - średnia - duża - bardzo duża. Średnia kraju to 123 osoby/ km2, mediana powiatów to 90,5, średnia powiatów to 375. English: Poland – population of counties. The size of each county shows its population, with some approximation. Each colour is 1/5 of the total number of counties arranged by population density, thus corresponding to a classification: very low - low - medium - high - very high. The country average is 123 people/ km2, counties' median 90.5, counties' average 375. |
| Date | |
| Source | Own work based on: gęstość zaludnienia z Powierzchnia i ludność w przekroju terytorialnym w 2015 r. Główny Urząd Statystyczny. |
| Author | PawełS |
| Other versions |
 |
| SVG development |
Software:
- ScapeToad (First grid 1 600; Diffusion grid size 1024; 8 iterations)
- Cartogram Creator plugin 10 iterations
Licensing[edit]
I, the copyright holder of this work, hereby publish it under the following license:
This file is licensed under the Creative Commons Attribution-Share Alike 3.0 Unported license.
- You are free:
- to share – to copy, distribute and transmit the work
- to remix – to adapt the work
- Under the following conditions:
- attribution – You must give appropriate credit, provide a link to the license, and indicate if changes were made. You may do so in any reasonable manner, but not in any way that suggests the licensor endorses you or your use.
- share alike – If you remix, transform, or build upon the material, you must distribute your contributions under the same or compatible license as the original.
File history
Click on a date/time to view the file as it appeared at that time.
| Date/Time | Thumbnail | Dimensions | User | Comment | |
|---|---|---|---|---|---|
| current | 19:37, 13 February 2019 | | 1,178 × 913 (665 KB) | PawełS (talk | contribs) | Legenda |
| 20:54, 22 March 2017 |  | 1,178 × 913 (665 KB) | PawełS (talk | contribs) | Piaseczyński do wyższej klasy, żeby zwiększyć odrębność klas | |
| 18:20, 14 March 2017 |  | 1,178 × 913 (664 KB) | PawełS (talk | contribs) | + gęstość zaludnienia + population density | |
| 21:48, 27 March 2013 |  | 1,074 × 906 (763 KB) | PawełS (talk | contribs) | {{Information |description={{pl|1=Liczba mieszkańców wg powiatów. Wielkość powiatów jest w przybliżeniu proporcjonalna do liczby mieszkańców. Im ciemniejszy kolor, tym większa jest rzeczywista powierzchnia powiatu.}}{{en|1=Poland – populati... |
You cannot overwrite this file.
File usage on Commons
The following page uses this file:
File usage on other wikis
The following other wikis use this file:
- Usage on ba.wikipedia.org
- Usage on en.wikipedia.org
- Usage on pl.wikipedia.org
- Usage on sah.wikipedia.org