File:Aktywność słoneczna.png
Aktywność_słoneczna.png (700 × 466 pixels, file size: 30 KB, MIME type: image/png)
Captions
Captions
Summary[edit]
| Description |
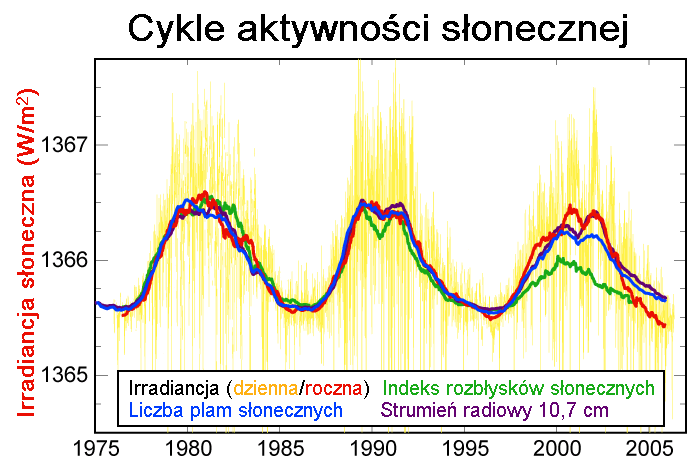
English:   This picture depicts the last three solar cycles as measured in solar irradiance, sunspot numbers, solar flare activity, and 10.7 cm radio flux. Solar irradiance, i.e the direct solar power at the top of the Earth's atmosphere, is depicted as both a daily measurement and a moving annual average. All other data are depicted as the annual average value. The ~11 year solar magnetic cycle is a fundemental aspect of the sun's behavior and is associated with variations in total output and activity. Irradiance measurements have only been available during the last three cycles and are based on a composite of many different observing satellites. [1] However, the high correlation between irradiance measurements and other proxies of solar activity make it reasonable to estimate past solar activity. Most important among these proxies is the record of sunspot observations that has been recorded since ~1610. Since sunspots and associated faculae are directly responsible for small changes in the brightness of the sun, they are closely correlated to changes in solar output. Direct measurements of radio emissions from the Sun at 10.7 cm also provide a proxy of solar activity that can be measured from the ground since the Earth's atmosphere is transparent at this wavelength. Lastly, solar flares are a type of solar activity that can impact life on Earth by affecting electrical systems, especially satellites. Flares usually occur in the presence of sunspots, and hence the two are correlated, but flares themselves make only tiny perturbations of the solar luminosity. Recently, it has been claimed that the total solar irradiance is varying in ways that aren't duplicated by changes in sunspot observations or radio emissions. However, this conclusion is disputed. Some believe that shifts in irradiance may be the result of calibration problems in the measuring satellites.[1][2] These speculations also admit the possibility that a small long-term trend might exist in solar irradiance, though the data chosen for this plot do not have a significant trend.[3] Also, the differences in flare activity over the three cycles would not be related to possible measurement artifacts in irradiance. With respect to global warming, though solar activity has been at relatively high levels during the recent period, the fact that solar activity has been near constant during the last 30 years precludes solar variability from playing a large role in recent warming. It is estimated that the resdiual effects of the prolonged high solar activity account for between 18 and 36% of warming from 1950 to 1999.[4] Image from Global Warming Art
This image is an original work created for Global Warming Art. Please refer to the image description page for more information.
Data sources
References
|
||||||||
| Date | |||||||||
| Source | File:Solar-cycle-data.png | ||||||||
| Author |
This image was created by Robert A. Rohde from the published data listed below and replaces an image created by William M. Connolley. It is part of the Global Warming Art project. Translation: Dobrzejest, wikipedia.pl : Adi4000 |

File history
Click on a date/time to view the file as it appeared at that time.
| Date/Time | Thumbnail | Dimensions | User | Comment | |
|---|---|---|---|---|---|
| current | 16:18, 10 July 2015 | | 700 × 466 (30 KB) | Szczureq (talk | contribs) | Ramka z polskim opisem zamiast zostawionego angielskiego |
| 19:56, 11 May 2008 |  | 700 × 466 (44 KB) | Adi (talk | contribs) | == Opis == thumb|right|350px|Variations in sunspot number since 1610. thumb|right|250px|Changes in solar activity since 1400. This picture depicts the last three [[w:solar cycle|solar cy |
You cannot overwrite this file.
File usage on Commons
There are no pages that use this file.
File usage on other wikis
The following other wikis use this file: