File:Change in Average Temperature With Fahrenheit.svg
Jump to navigation
Jump to search

Size of this PNG preview of this SVG file: 666 × 599 pixels. Other resolutions: 267 × 240 pixels | 533 × 480 pixels | 853 × 768 pixels | 1,138 × 1,024 pixels | 2,276 × 2,048 pixels | 960 × 864 pixels.
Original file (SVG file, nominally 960 × 864 pixels, file size: 236 KB)
Captions
Captions
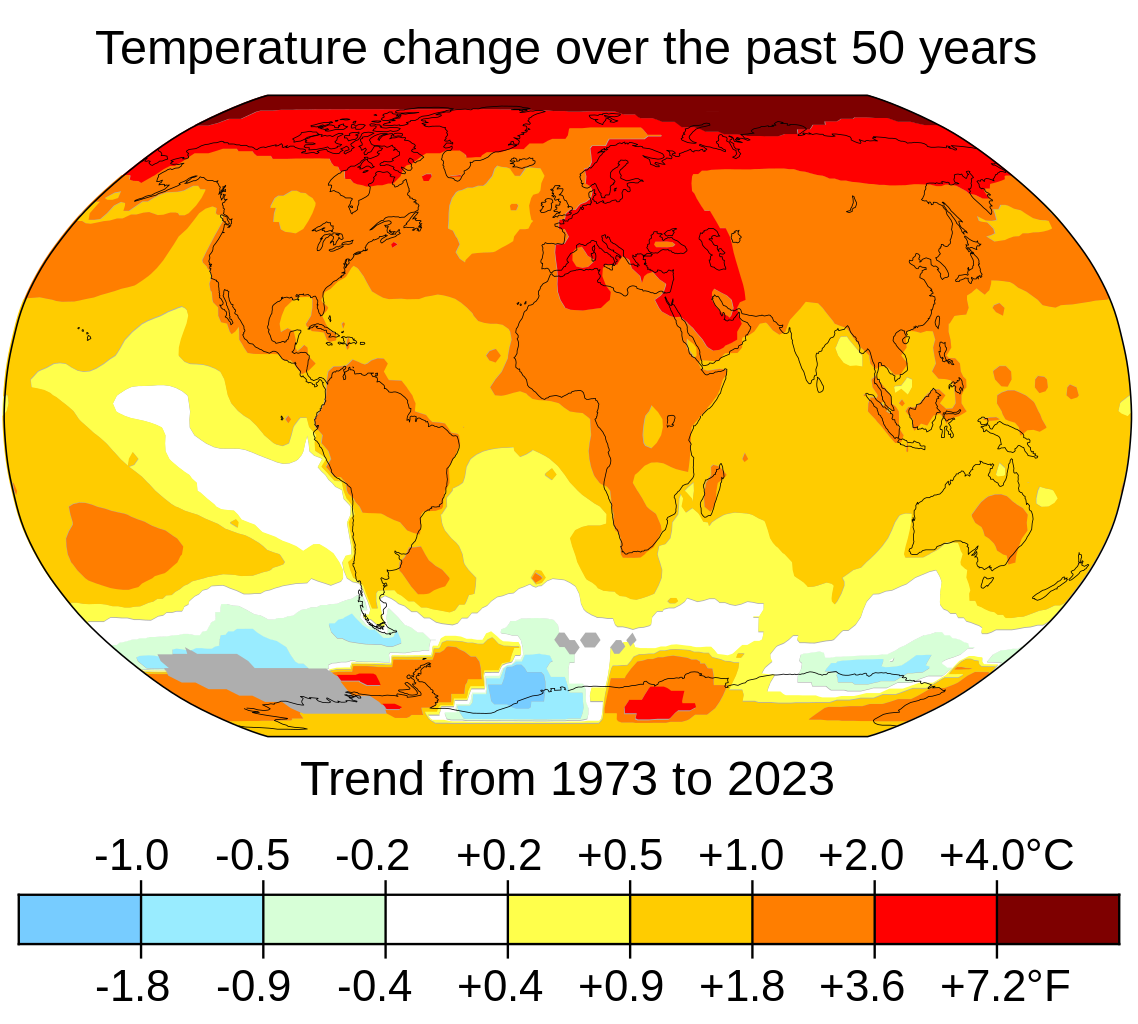
Surface air temperature change over the past 50 years
Summary[edit]
| Description |
English: Surface air temperature changes to date have been most pronounced in northern latitudes and over land masses. The image uses the trend of annual averages to smooth out climate variability due to factors such as El Niño. The map is improved from the highest quality rendering that NASA’s Scientific Visualization Studio generates, with horizontal and vertical lines removed and with a more legible projection of Kavraiskiy VII. Grey areas in the image have insufficient data for rendering. For a version without Fahrenheit, see File:Change in Average Temperature.svg |
| Date | |
| Source | https://data.giss.nasa.gov/gistemp/maps/index_v4.html |
| Author | NASA’s Scientific Visualization Studio, Key and Title by uploader (Eric Fisk) |
| Other versions | Arabic (العربية), French |
Licensing[edit]
I, the copyright holder of this work, hereby publish it under the following license:
This file is licensed under the Creative Commons Attribution-Share Alike 4.0 International license.
- You are free:
- to share – to copy, distribute and transmit the work
- to remix – to adapt the work
- Under the following conditions:
- attribution – You must give appropriate credit, provide a link to the license, and indicate if changes were made. You may do so in any reasonable manner, but not in any way that suggests the licensor endorses you or your use.
- share alike – If you remix, transform, or build upon the material, you must distribute your contributions under the same or compatible license as the original.
File history
Click on a date/time to view the file as it appeared at that time.
| Date/Time | Thumbnail | Dimensions | User | Comment | |
|---|---|---|---|---|---|
| current | 03:34, 13 January 2024 | | 960 × 864 (236 KB) | Tofeiku (talk | contribs) | File uploaded using svgtranslate tool (https://svgtranslate.toolforge.org/). Added translation for ms. |
| 21:15, 12 January 2024 |  | 960 × 864 (234 KB) | Efbrazil (talk | contribs) | Minor wording and graphic tweaks | |
| 20:46, 12 January 2024 |  | 960 × 864 (234 KB) | Efbrazil (talk | contribs) | Text tweak: in the last 50 years --> over the last 50 years | |
| 19:36, 12 January 2024 |  | 960 × 864 (234 KB) | Efbrazil (talk | contribs) | Updated to 2023 annual data, change from average to trend line | |
| 11:19, 1 August 2023 |  | 960 × 864 (276 KB) | Jirka Dl (talk | contribs) | File uploaded using svgtranslate tool (https://svgtranslate.toolforge.org/). Added translation for cs. | |
| 09:23, 1 August 2023 |  | 960 × 864 (273 KB) | Jirka Dl (talk | contribs) | File uploaded using svgtranslate tool (https://svgtranslate.toolforge.org/). Added translation for cs. | |
| 09:55, 28 August 2022 |  | 960 × 864 (271 KB) | Kleinpecan (talk | contribs) | Use en dashes and minuses instead of hyphens | |
| 21:17, 13 January 2022 |  | 960 × 864 (271 KB) | Efbrazil (talk | contribs) | Updated for 2021 data | |
| 23:19, 7 December 2021 |  | 960 × 864 (298 KB) | Efbrazil (talk | contribs) | Added Fahrenheit, when move happens, will change base file to drop fahrenheit | |
| 01:07, 7 December 2021 |  | 960 × 816 (293 KB) | Efbrazil (talk | contribs) | Uploaded own work with UploadWizard |
You cannot overwrite this file.
File usage on Commons
There are no pages that use this file.
File usage on other wikis
The following other wikis use this file:
- Usage on ar.wikipedia.org
- Usage on azb.wikipedia.org
- Usage on bcl.wikipedia.org
- Usage on bn.wikipedia.org
- Usage on bs.wikipedia.org
- Usage on el.wikipedia.org
- Usage on en.wikipedia.org
- Climate
- Developing country
- Instrumental temperature record
- Atlantic humpback dolphin
- Effects of climate change
- Portal:Earth sciences
- Climate change
- Portal:Geology
- User:The Transhumanist
- Rain
- Portal:Climate change/Intro
- Global surface temperature
- Fire and carbon cycling in boreal forests
- Portal:Countries
- Sustainable Development Goal 13
- Portal:Climate change
- Wikipedia:Reference desk/Archives/Miscellaneous/2022 August 7
- User:Bt021/Atlantic humpback dolphin
- Wikipedia:Wikipedia Signpost/2022-09-30/News and notes
- Talk:Climate change/Archive 94
- Usage on en.wikiquote.org
- Usage on eo.wikipedia.org
- Usage on fa.wikipedia.org
- Usage on gv.wikipedia.org
- Usage on ha.wikipedia.org
- Usage on hy.wikipedia.org
- Usage on ig.wikipedia.org
- Usage on ig.wiktionary.org
- Usage on ko.wikipedia.org
- Usage on mn.wikipedia.org
- Usage on ms.wikipedia.org
- Usage on pt.wikipedia.org
- Usage on ro.wikipedia.org
- Usage on rw.wikipedia.org
- Usage on so.wikipedia.org
View more global usage of this file.