File:Price of oil (2003-2008).png
Jump to navigation
Jump to search
Size of this preview: 799 × 600 pixels. Other resolutions: 320 × 240 pixels | 640 × 480 pixels | 1,023 × 768 pixels | 1,027 × 771 pixels.
Original file (1,027 × 771 pixels, file size: 39 KB, MIME type: image/png)
Captions
Captions
Add a one-line explanation of what this file represents
Summary[edit]
| Description |
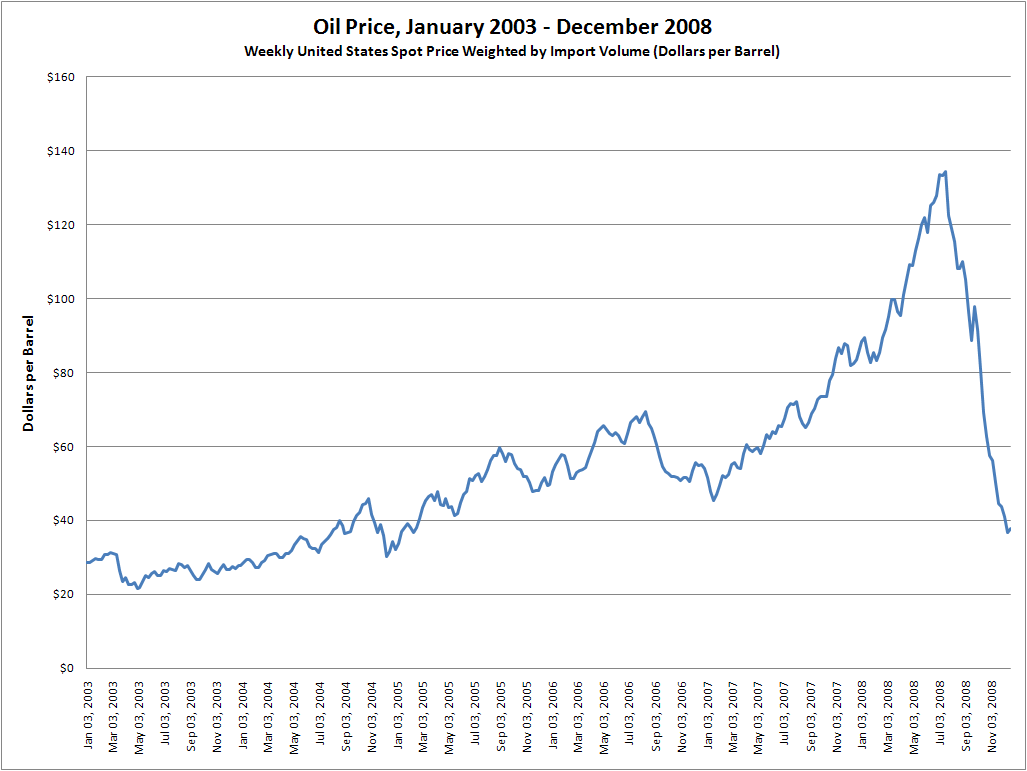
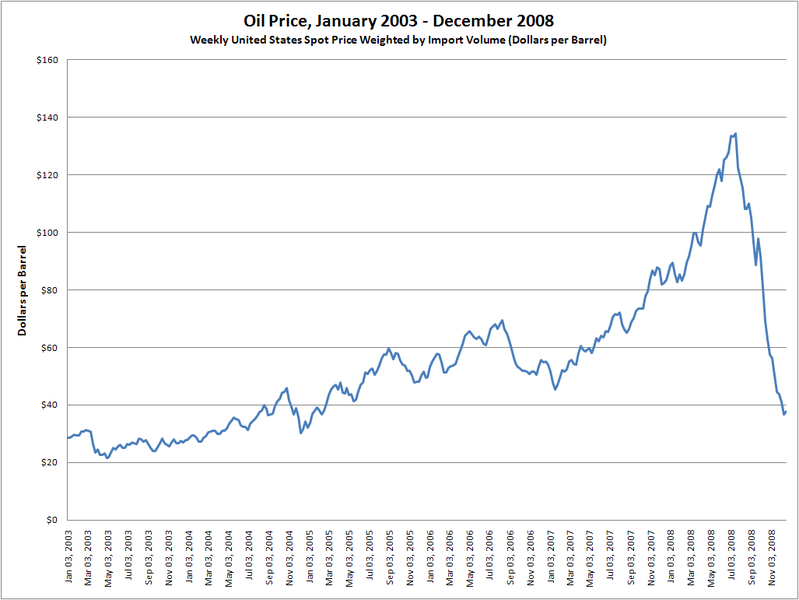
English: Chart showing the weekly United States spot price of crude oil from January 2003 to December 2008 in USD. Chart generated in Microsoft Excel 2007. Data from http://tonto.eia.doe.gov/dnav/pet/hist/wtotusaw.htm (United States Department of Energy) Shown in current prices. |
||
| Date | |||
| Source | Own work | ||
| Author | Equilibrium007 | ||
| Other versions |
|
_(cropped).png)

.png&action=edit§ion=1)
Licensing[edit]
.png&action=edit§ion=2)
| I, the copyright holder of this work, release this work into the public domain. This applies worldwide. In some countries this may not be legally possible; if so: I grant anyone the right to use this work for any purpose, without any conditions, unless such conditions are required by law. |
File history
Click on a date/time to view the file as it appeared at that time.
| Date/Time | Thumbnail | Dimensions | User | Comment | |
|---|---|---|---|---|---|
| current | 07:33, 27 December 2008 | | 1,027 × 771 (39 KB) | Equilibrium007 (talk | contribs) | {{Information |Description={{en|1=Chart showing the weekly United States spot price of crude oil from January 2003 to December 2008 in USD. Chart generated in Microsoft Excel 2007. Data from http://tonto.eia.doe.gov/dnav/pet/hist/wtotusaw.htm (United Stat |
You cannot overwrite this file.
File usage on Commons
The following page uses this file:
File usage on other wikis
The following other wikis use this file:
- Usage on ca.wikipedia.org
- Usage on cs.wikipedia.org
- Usage on en.wikipedia.org
- Usage on es.wikipedia.org
- Usage on fa.wikipedia.org
- Usage on he.wikipedia.org
- Usage on it.wikipedia.org
- Usage on lt.wikipedia.org
- Usage on pl.wikipedia.org
- Usage on sk.wikipedia.org
- Usage on www.wikidata.org
.png&oldid=705028781)