File:2005orange.PNG
Jump to navigation
Jump to search
Size of this preview: 800 × 351 pixels. Other resolutions: 320 × 140 pixels | 640 × 281 pixels | 1,425 × 625 pixels.
Original file (1,425 × 625 pixels, file size: 60 KB, MIME type: image/png)
Captions
Captions
Add a one-line explanation of what this file represents
| Description |
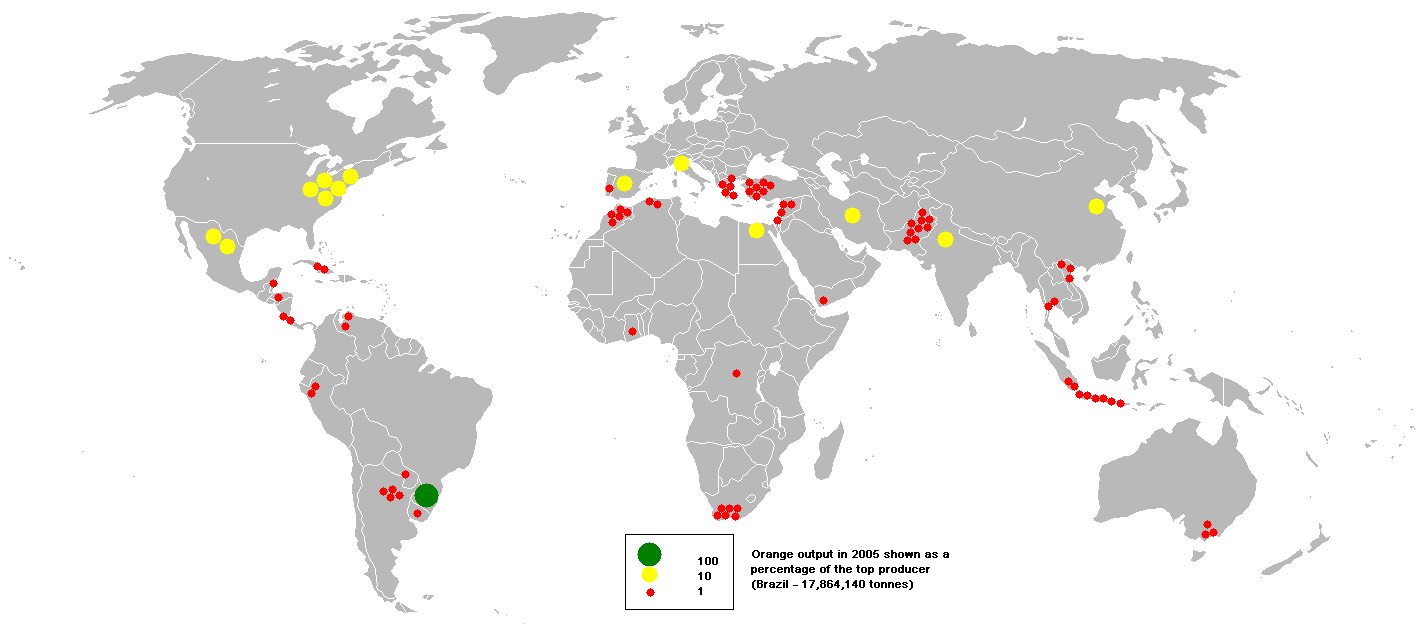
English: This bubble map shows the global distribution of orange output in 2005 as a percentage of the top producer (Brazil - 17,864,140 tonnes).
This map is consistent with incomplete set of data too as long as the top producer is known. It resolves the accessibility issues faced by colour-coded maps that may not be properly rendered in old computer screens. |
||
| Date | |||
| Source |
Data was extracted on 8th June 2007 from http://faostat.fao.org/site/336/DesktopDefault.aspx?PageID=336 Based on Image:BlankMap-World.png |
||
| Author | en:user:Anwar saadat | ||
| Permission (Reusing this file) |
|
File history
Click on a date/time to view the file as it appeared at that time.
| Date/Time | Thumbnail | Dimensions | User | Comment | |
|---|---|---|---|---|---|
| current | 19:24, 3 October 2009 | | 1,425 × 625 (60 KB) | Serg!o (talk | contribs) | {{Information |Description={{en|This bubble map shows the global distribution of orange output in 2005 as a percentage of the top producer (Brazil - 17,864,140 tonnes). This map is consistent with incomplete set of |
You cannot overwrite this file.
File usage on Commons
There are no pages that use this file.
File usage on other wikis
The following other wikis use this file:
- Usage on ca.wikipedia.org
- Usage on eo.wikipedia.org
- Usage on es.wikipedia.org
- Usage on ka.wikipedia.org
- Usage on zh.wikipedia.org