File:Carbon dioxide pressure-temperature phase diagram.svg
Jump to navigation
Jump to search

Size of this PNG preview of this SVG file: 636 × 600 pixels. Other resolutions: 254 × 240 pixels | 509 × 480 pixels | 814 × 768 pixels | 1,085 × 1,024 pixels | 2,171 × 2,048 pixels | 742 × 700 pixels.
Original file (SVG file, nominally 742 × 700 pixels, file size: 26 KB)
Captions
Captions
Add a one-line explanation of what this file represents
Summary[edit]
| Description |
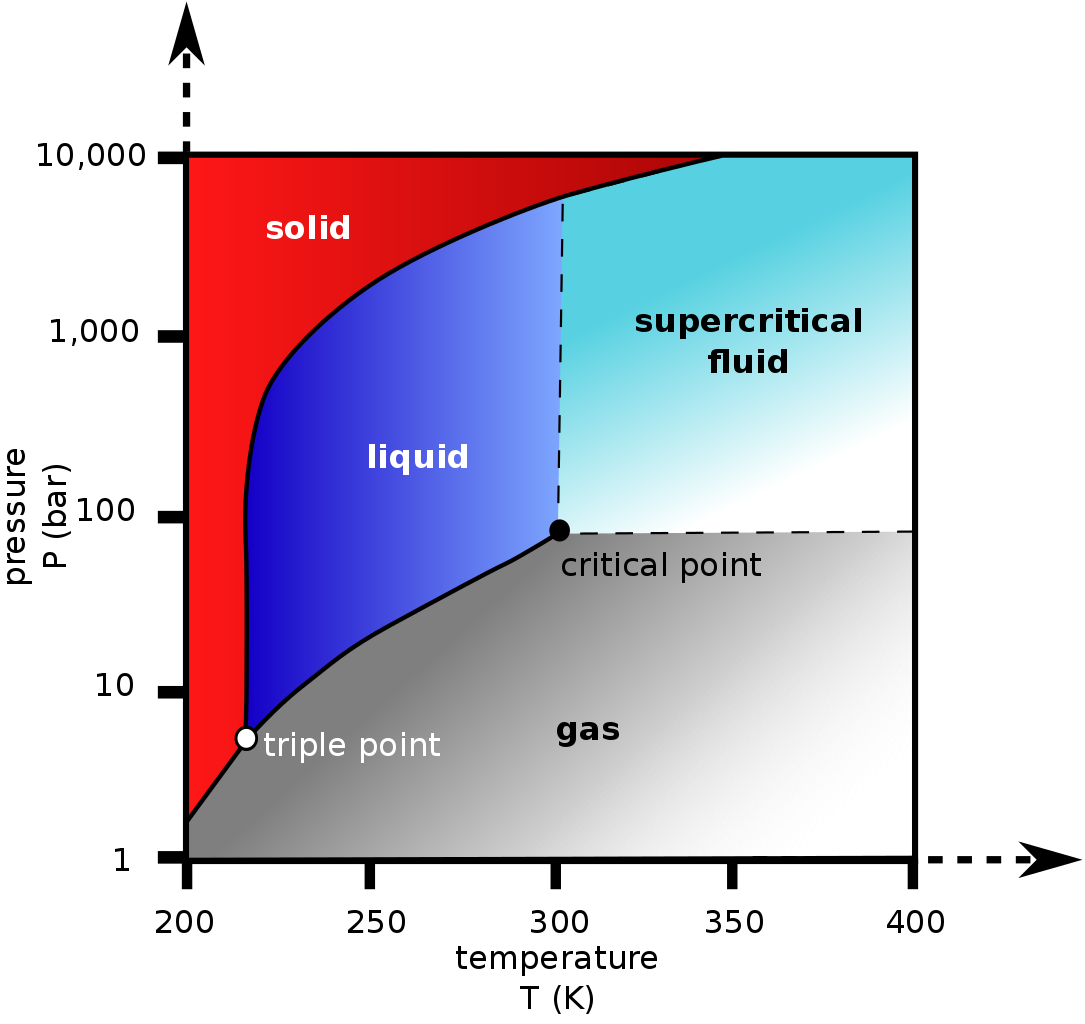
English: Phase diagram of CO2 (carbon dioxide).
X axis is temperature in kelvin; Y axis is pressure in bar. |
| Date | |
| Source | Commons, Carbon dioxide pressure-temperature phase diagram.jpg |
| Author |
|
| Other versions |
[]
.jpg:
.png:
|
| SVG development | This diagram was created with Inkscape…important. This diagram uses translateable embedded text. |


.svg)
Licensing[edit]
I, the copyright holder of this work, hereby publish it under the following license:
| This file is made available under the Creative Commons CC0 1.0 Universal Public Domain Dedication. | |
| The person who associated a work with this deed has dedicated the work to the public domain by waiving all of their rights to the work worldwide under copyright law, including all related and neighboring rights, to the extent allowed by law. You can copy, modify, distribute and perform the work, even for commercial purposes, all without asking permission.
|
File history
Click on a date/time to view the file as it appeared at that time.
| Date/Time | Thumbnail | Dimensions | User | Comment | |
|---|---|---|---|---|---|
| current | 11:09, 30 December 2011 | | 742 × 700 (26 KB) | Pieter Kuiper (talk | contribs) | Reverted to version as of 22:48, 16 January 2011 revert to version in English |
| 10:23, 30 December 2011 |  | 797 × 741 (26 KB) | Iyntx (talk | contribs) | убрал ненужную прозрачность в фоне "сверхкритической жидкости" | |
| 10:22, 30 December 2011 |  | 797 × 741 (26 KB) | Iyntx (talk | contribs) | убрал ненужную прозрачность в фоне "сверхкритической жидкости" | |
| 10:20, 30 December 2011 |  | 797 × 741 (25 KB) | Iyntx (talk | contribs) | Пересоздал файл с нуля, выровнял кривые, убрал ничего не значащие отметки погрешности, | |
| 22:48, 16 January 2011 |  | 742 × 700 (26 KB) | Anynobody~commonswiki (talk | contribs) | various fixes | |
| 03:31, 30 November 2010 |  | 711 × 677 (30 KB) | Bignose (talk | contribs) | Align text better, add labels for triple and critical point | |
| 03:02, 30 November 2010 |  | 711 × 677 (26 KB) | Bignose (talk | contribs) | Fix arrowhead directions, liquid area curve | |
| 02:38, 30 November 2010 |  | 711 × 677 (27 KB) | Bignose (talk | contribs) | Use lines and arrowheads for ticks and axes | |
| 02:34, 30 November 2010 |  | 711 × 677 (27 KB) | Bignose (talk | contribs) | Use lines and arrows for axes and ticks | |
| 08:57, 3 July 2008 |  | 711 × 677 (24 KB) | Anynobody~commonswiki (talk | contribs) | {{Information |Description= |Source= |Date= |Author= |Permission= |other_versions= }} |
You cannot overwrite this file.
File usage on Commons
The following 20 pages use this file:
- File:CO2-phase-diagram-greek.svg
- File:Carbon dioxide p-T phase diagram.svg
- File:Carbon dioxide pressure-temperature phase diagram-en.svg
- File:Carbon dioxide pressure-temperature phase diagram-fr.svg
- File:Carbon dioxide pressure-temperature phase diagram-ru.svg
- File:Carbon dioxide pressure-temperature phase diagram.jpg
- File:Carbon dioxide pressure-temperature phase diagram.svg
- File:Carbon dioxide pressure-temperature phase diagram SK.jpg
- File:Carbon dioxide pressure-temperature phase diagram deutsch.png
- File:Carbon dioxide pressure-temperature phase diagram deutsch.svg
- File:Carbon dioxide pressure-temperature phase diagram international.png
- File:Carbon dioxide pressure-temperature phase diagram international.svg
- File:Carbon dioxide pressure-temperature phase diagram mk.svg
- File:Diagramma di fase CO2.svg
- File:Fasdiagram (koldioxid).svg
- File:Fázový diagram tlak-teplota pro oxid uhličitý.svg
- File:Karbondioksid trykk-temperatur fasediagram.svg
- File:Phase changes of CO2.png
- File:Διάγραμμα φάσεων CO2.png
- Template:Other versions/Carbon dioxide pressure-temperature phase diagram
File usage on other wikis
The following other wikis use this file:
- Usage on be.wikipedia.org
- Usage on bg.wikipedia.org
- Usage on bn.wikipedia.org
- Usage on bs.wikipedia.org
- Usage on cs.wikipedia.org
- Usage on da.wikipedia.org
- Usage on el.wikipedia.org
- Usage on en.wikipedia.org
- Usage on en.wikiversity.org
- Usage on eo.wikipedia.org
- Usage on et.wikipedia.org
- Usage on fa.wikipedia.org
- Usage on fr.wikipedia.org
- Usage on he.wikipedia.org
- Usage on hr.wikipedia.org
- Usage on hu.wikipedia.org
- Usage on id.wikipedia.org
- Usage on it.wikipedia.org
- Usage on kn.wikipedia.org
- Usage on mk.wikipedia.org
- Usage on ml.wikipedia.org
- Usage on nl.wikipedia.org
- Usage on pl.wikipedia.org
- Usage on pt.wikipedia.org
- Usage on ro.wikipedia.org
- Usage on ru.wikipedia.org
- Usage on si.wikipedia.org
- Usage on sl.wikipedia.org
- Usage on sr.wikipedia.org
- Usage on ta.wikipedia.org
View more global usage of this file.