File:2D Wavefunction (2,2) Surface Plot.png
Jump to navigation
Jump to search
Size of this preview: 800 × 600 pixels. Other resolutions: 320 × 240 pixels | 640 × 480 pixels | 1,024 × 768 pixels | 1,280 × 960 pixels | 1,575 × 1,181 pixels.
Original file (1,575 × 1,181 pixels, file size: 605 KB, MIME type: image/png)
Captions
Captions
Add a one-line explanation of what this file represents
| Description |
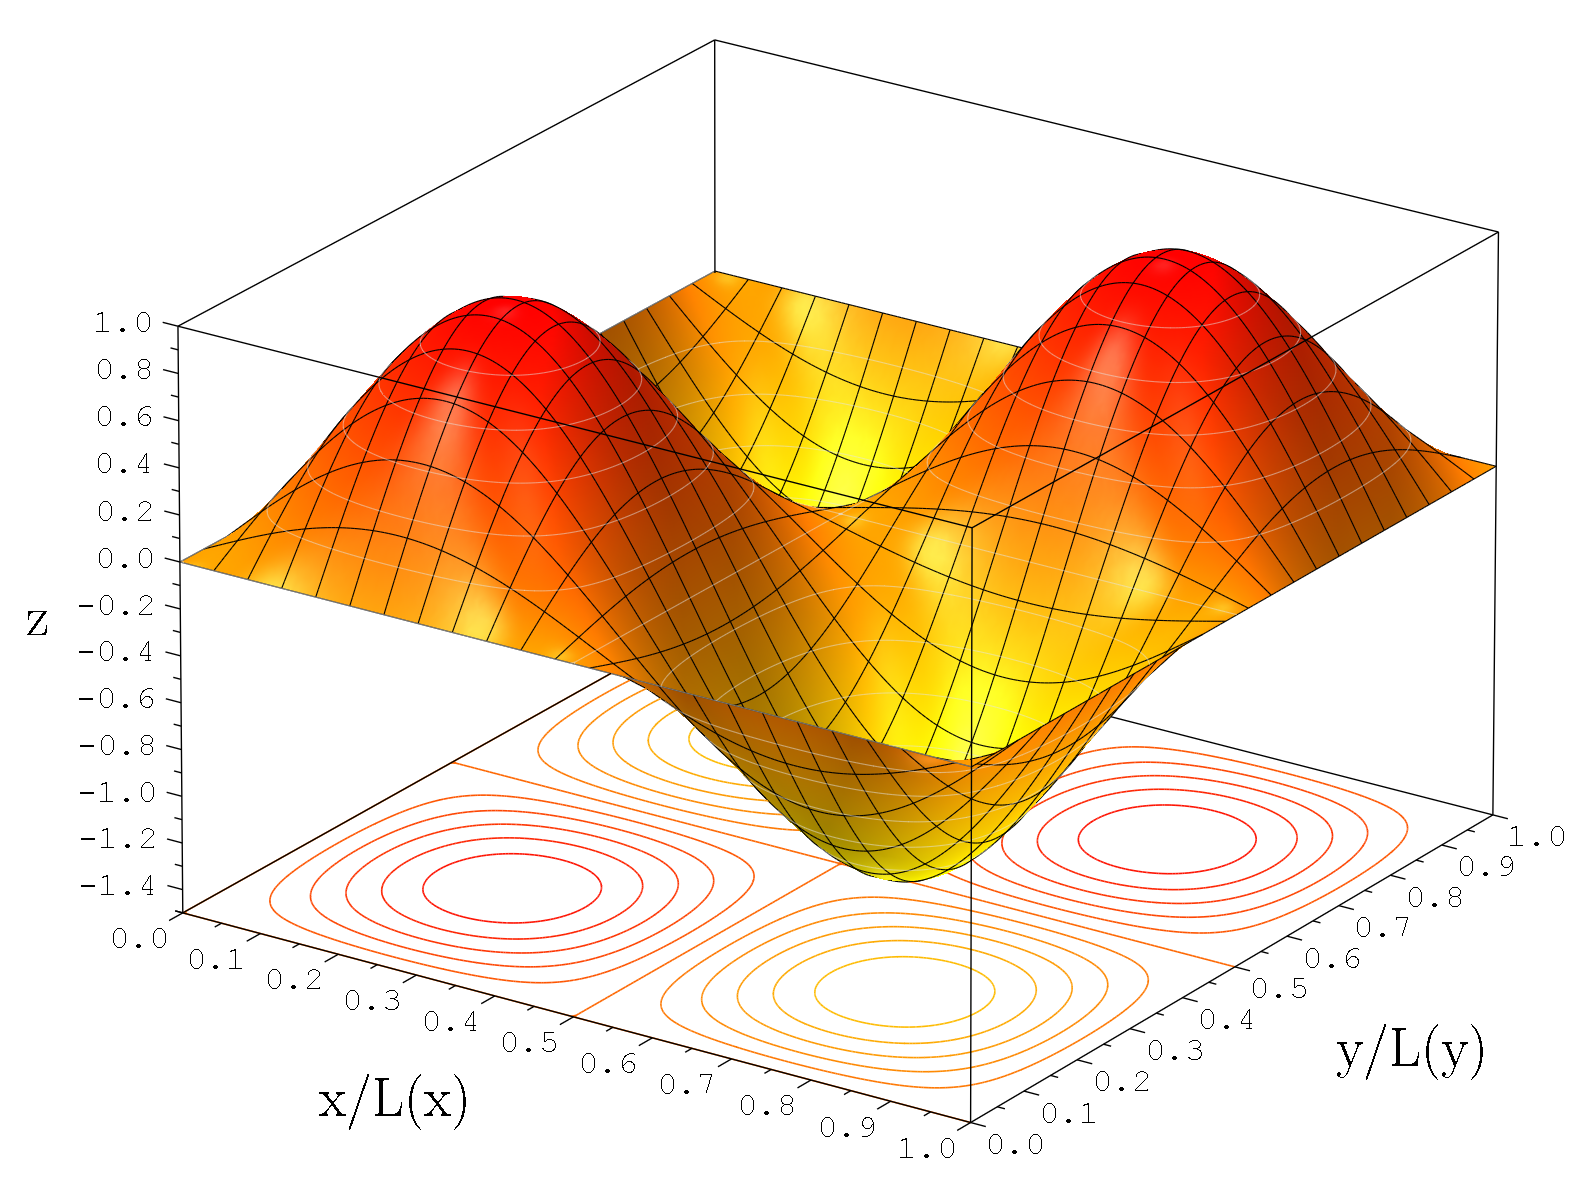
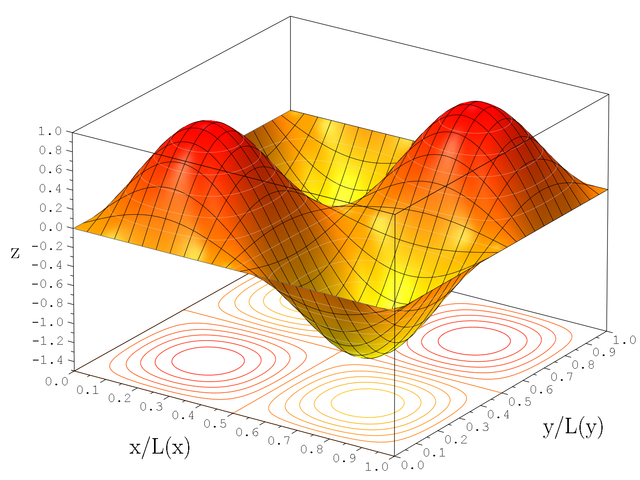
The quantum wavefunction of a particle in a 2D infinite potential well of dimensions Lx and Ly. The wavenumbers are:
The wavefunction, shown as z on the plot, is given by: |
||
| Date | |||
| Source | Own drawing, plotted in MuPad. | ||
| Author | Inductiveload | ||
| Permission (Reusing this file) |
|
||
| Other versions | See 2D Quantum Wavefunctions for more plots. |

Mathematica Code[edit]
_Surface_Plot.png&action=edit§ion=1)
This code does not require any packages to be loaded.
nx = 3
ny = 2
Plot3D[
  Sin[nx Pi x]Sin[ny Pi y],
  {x, 0, 1},
  {y, 0, 1},
  ImageSize -> '''250''',
  BoxRatios -> {2, 2, 2},
  AxesLabel -> {x/Subscript[2L, x], y/Subscript[L, y], Subscript[ψ, "1,1"]},
  PlotRange -> {-1, 1},
  TextStyle -> {FontSize -> 96}
  ]
MuPAD Code[edit]
_Surface_Plot.png&action=edit§ion=2)
nx := 2:
ny := 2:
f := sin(nx*x*PI) * sin(ny*y*PI):

  conts := 16:
  projectionlevel:=-1.5:

colourfunc := zip(RGB::Red, RGB::Yellow,
                  (a, b) -> (f(x,y)+1)/(2)*a
                           -(f(x,y)-1)/(2)*b):

funcplot := plot::Function3d(f(x,y),
                             x = 0..1,
                             y = 0..1,
                             Mesh = [24, 24],
                             Submesh=[8,8],
                             LineColor = RGB::Black.[0.99],
                             LineWidth = 0.15,
                             FillColorFunction = colourfunc,
                             AxesTitleFont = ["BKM-cmr17", 20],
                             TicksLabelFont = ["Courier New", 12],
                             ViewingBoxZRange = -1.5..1
                            ):

contours := plot::modify(funcplot,
                         ZContours = [Automatic, conts],
                         LineWidth = 0.15,
                         LineColor = RGB::Gray90.[0.5],
                         XLinesVisible = FALSE,
                         YLinesVisible = FALSE,
                         Filled = FALSE
                        ):

projcontours := plot::Transform3d([0, 0, projectionlevel],
                                  [1, 0, 0, 0, 1, 0, 0, 0, 0],
                                   plot::modify(funcplot, ZContours = [Automatic, conts],
                                                LineWidth = 0.2,
                                                LineColorType = Dichromatic,
                                                LineColor = RGB::Red.[0.99],
                                                LineColor2 = RGB::Yellow.[0.99],
                                                XLinesVisible = FALSE,
                                                YLinesVisible = FALSE,
                                                Filled = FALSE
                                               )
                                  ):

camera := plot::Camera([17, -24, 45],
                       [0.5, 0.4, -0.2],
                       0.038
                      ):

ploteverything := plot::Canvas(funcplot, contours, projcontours,
                               Width = 200*unit::mm,
                               Height = 150*unit::mm,
                               AxesTitles = ["x/L(x)", "y/L(y)", "z"],
                               camera
                              ):

plot(ploteverything)
File history
Click on a date/time to view the file as it appeared at that time.
| Date/Time | Thumbnail | Dimensions | User | Comment | |
|---|---|---|---|---|---|
| current | 22:58, 4 August 2007 | | 1,575 × 1,181 (605 KB) | Inductiveload (talk | contribs) | |
| 01:49, 19 February 2007 |  | 1,575 × 1,181 (627 KB) | Inductiveload (talk | contribs) | muPAD Plot | |
| 04:49, 13 February 2007 |  | 2,499 × 2,713 (164 KB) | Inductiveload (talk | contribs) | {{Information |Description=The quantum wavefunction of a particle in a 2D box of dimensions L<sub>x</sub> and L<sub>y</sub>. The wavenumbers are: *''n<sub>x</sub>''=2 *''n<sub>y</sub>''=2 |Source=Own drawing, plotted in Mathematica. |Date=13/02/2007 |Au |
You cannot overwrite this file.
File usage on Commons
The following page uses this file:
File usage on other wikis
The following other wikis use this file:
- Usage on de.wikipedia.org
- Usage on es.wikipedia.org
- Usage on gl.wikipedia.org
_Surface_Plot.png&oldid=766988054)