Rna-Seq
RNA-Seq (named as an abbreviation of RNA sequencing) is a technique that uses next-generation sequencing to reveal the presence and quantity of RNA molecules in a biological sample, providing a snapshot of gene expression in the sample, also known as transcriptome.

Specifically, RNA-Seq facilitates the ability to look at alternative gene spliced transcripts, post-transcriptional modifications, gene fusion, mutations/SNPs and changes in gene expression over time, or differences in gene expression in different groups or treatments. In addition to mRNA transcripts, RNA-Seq can look at different populations of RNA to include total RNA, small RNA, such as miRNA, tRNA, and ribosomal profiling. RNA-Seq can also be used to determine exon/intron boundaries and verify or amend previously annotated 5' and 3' gene boundaries. Recent advances in RNA-Seq include single cell sequencing, bulk RNA sequencing, in situ sequencing of fixed tissue, and native RNA molecule sequencing with single-molecule real-time sequencing. Other examples of emerging RNA-Seq applications due to the advancement of bioinformatics algorithms are copy number alteration, microbial contamination, transposable elements, cell type (deconvolution) and the presence of neoantigens.
Prior to RNA-Seq, gene expression studies were done with hybridization-based microarrays. Issues with microarrays include cross-hybridization artifacts, poor quantification of lowly and highly expressed genes, and needing to know the sequence a priori. Because of these technical issues, transcriptomics transitioned to sequencing-based methods. These progressed from Sanger sequencing of Expressed sequence tag libraries, to chemical tag-based methods (e.g., serial analysis of gene expression), and finally to the current technology, next-gen sequencing of complementary DNA (cDNA), notably RNA-Seq.

Methods
Library preparation

The general steps to prepare a complementary DNA (cDNA) library for sequencing are described below, but often vary between platforms.
- RNA Isolation: RNA is isolated from tissue and mixed with Deoxyribonuclease (DNase). DNase reduces the amount of genomic DNA. The amount of RNA degradation is checked with gel and capillary electrophoresis and is used to assign an RNA integrity number to the sample. This RNA quality and the total amount of starting RNA are taken into consideration during the subsequent library preparation, sequencing, and analysis steps.
- RNA selection/depletion: To analyze signals of interest, the isolated RNA can either be kept as is, enriched for RNA with 3' polyadenylated (poly(A)) tails to include only eukaryotic mRNA, depleted of ribosomal RNA (rRNA), and/or filtered for RNA that binds specific sequences (RNA selection and depletion methods table, below). RNA molecules having 3' poly(A) tails in eukaryotes are mainly composed of mature, processed, coding sequences. Poly(A) selection is performed by mixing RNA with poly(T) oligomers covalently attached to a substrate, typically magnetic beads. Poly(A) selection has important limitations in RNA biotype detection. Many RNA biotypes are not polyadenylated, including many noncoding RNA and histone-core protein transcripts, or are regulated via their poly(A) tail length (e.g., cytokines) and thus might not be detected after poly(A) selection. Furthermore, poly(A) selection may display increased 3' bias, especially with lower quality RNA. These limitations can be avoided with ribosomal depletion, removing rRNA that typically represents over 90% of the RNA in a cell. Both poly(A) enrichment and ribosomal depletion steps are labor intensive and could introduce biases, so more simple approaches have been developed to omit these steps. Small RNA targets, such as miRNA, can be further isolated through size selection with exclusion gels, magnetic beads, or commercial kits.
- cDNA synthesis: RNA is reverse transcribed to cDNA because DNA is more stable and to allow for amplification (which uses DNA polymerases) and leverage more mature DNA sequencing technology. Amplification subsequent to reverse transcription results in loss of strandedness, which can be avoided with chemical labeling or single molecule sequencing. Fragmentation and size selection are performed to purify sequences that are the appropriate length for the sequencing machine. The RNA, cDNA, or both are fragmented with enzymes, sonication, or nebulizers. Fragmentation of the RNA reduces 5' bias of randomly primed-reverse transcription and the influence of primer binding sites, with the downside that the 5' and 3' ends are converted to DNA less efficiently. Fragmentation is followed by size selection, where either small sequences are removed or a tight range of sequence lengths are selected. Because small RNAs like miRNAs are lost, these are analyzed independently. The cDNA for each experiment can be indexed with a hexamer or octamer barcode, so that these experiments can be pooled into a single lane for multiplexed sequencing.
| Strategy | Predominant type of RNA | Ribosomal RNA content | Unprocessed RNA content | Isolation method |
|---|---|---|---|---|
| Total RNA | All | High | High | None |
| PolyA selection | Coding | Low | Low | Hybridization with poly(dT) oligomers |
| rRNA depletion | Coding, noncoding | Low | High | Removal of oligomers complementary to rRNA |
| RNA capture | Targeted | Low | Moderate | Hybridization with probes complementary to desired transcripts |
Complementary DNA sequencing (cDNA-Seq)
The cDNA library derived from RNA biotypes is then sequenced into a computer-readable format. There are many high-throughput sequencing technologies for cDNA sequencing including platforms developed by Illumina, Thermo Fisher, BGI/MGI, PacBio, and Oxford Nanopore Technologies. For Illumina short-read sequencing, a common technology for cDNA sequencing, adapters are ligated to the cDNA, DNA is attached to a flow cell, clusters are generated through cycles of bridge amplification and denaturing, and sequence-by-synthesis is performed in cycles of complementary strand synthesis and laser excitation of bases with reversible terminators. Sequencing platform choice and parameters are guided by experimental design and cost. Common experimental design considerations include deciding on the sequencing length, sequencing depth, use of single versus paired-end sequencing, number of replicates, multiplexing, randomization, and spike-ins.
Small RNA/non-coding RNA sequencing
When sequencing RNA other than mRNA, the library preparation is modified. The cellular RNA is selected based on the desired size range. For small RNA targets, such as miRNA, the RNA is isolated through size selection. This can be performed with a size exclusion gel, through size selection magnetic beads, or with a commercially developed kit. Once isolated, linkers are added to the 3' and 5' end then purified. The final step is cDNA generation through reverse transcription.
Direct RNA sequencing

Because converting RNA into cDNA, ligation, amplification, and other sample manipulations have been shown to introduce biases and artifacts that may interfere with both the proper characterization and quantification of transcripts, single molecule direct RNA sequencing has been explored by companies including Helicos (bankrupt), Oxford Nanopore Technologies, and others. This technology sequences RNA molecules directly in a massively-parallel manner.
Single-molecule real-time RNA sequencing
Massively parallel single molecule direct RNA-Seq has been explored as an alternative to traditional RNA-Seq, in which RNA-to-cDNA conversion, ligation, amplification, and other sample manipulation steps may introduce biases and artifacts. Technology platforms that perform single-molecule real-time RNA-Seq include Oxford Nanopore Technologies (ONT) Nanopore sequencing, PacBio IsoSeq, and Helicos (bankrupt). Sequencing RNA in its native form preserves modifications like methylation, allowing them to be investigated directly and simultaneously. Another benefit of single-molecule RNA-Seq is that transcripts can be covered in full length, allowing for higher confidence isoform detection and quantification compared to short-read sequencing. Traditionally, single-molecule RNA-Seq methods have higher error rates compared to short-read sequencing, but newer methods like ONT direct RNA-Seq limit errors by avoiding fragmentation and cDNA conversion. Recent uses of ONT direct RNA-Seq for differential expression in human cell populations have demonstrated that this technology can overcome many limitations of short and long cDNA sequencing.
Single-cell RNA sequencing (scRNA-Seq)
Standard methods such as microarrays and standard bulk RNA-Seq analysis analyze the expression of RNAs from large populations of cells. In mixed cell populations, these measurements may obscure critical differences between individual cells within these populations.
Single-cell RNA sequencing (scRNA-Seq) provides the expression profiles of individual cells. Although it is not possible to obtain complete information on every RNA expressed by each cell, due to the small amount of material available, patterns of gene expression can be identified through gene clustering analyses. This can uncover the existence of rare cell types within a cell population that may never have been seen before. For example, rare specialized cells in the lung called pulmonary ionocytes that express the Cystic fibrosis transmembrane conductance regulator were identified in 2018 by two groups performing scRNA-Seq on lung airway epithelia.
Experimental procedures
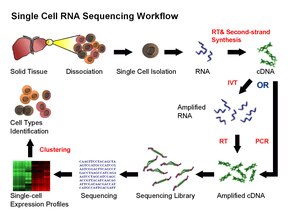
Current scRNA-Seq protocols involve the following steps: isolation of single cell and RNA, reverse transcription (RT), amplification, library generation and sequencing. Single cells are either mechanically separated into microwells (e.g., BD Rhapsody, Takara ICELL8, Vycap Puncher Platform, or CellMicrosystems CellRaft) or encapsulated in droplets (e.g., 10x Genomics Chromium, Illumina Bio-Rad ddSEQ, 1CellBio InDrop, Dolomite Bio Nadia). Single cells are labeled by adding beads with barcoded oligonucleotides; both cells and beads are supplied in limited amounts such that co-occupancy with multiple cells and beads is a very rare event. Once reverse transcription is complete, the cDNAs from many cells can be mixed together for sequencing; transcripts from a particular cell are identified by each cell's unique barcode. Unique molecular identifier (UMIs) can be attached to mRNA/cDNA target sequences to help identify artifacts during library preparation.
Challenges for scRNA-Seq include preserving the initial relative abundance of mRNA in a cell and identifying rare transcripts. The reverse transcription step is critical as the efficiency of the RT reaction determines how much of the cell's RNA population will be eventually analyzed by the sequencer. The processivity of reverse transcriptases and the priming strategies used may affect full-length cDNA production and the generation of libraries biased toward the 3’ or 5' end of genes.
In the amplification step, either PCR or in vitro transcription (IVT) is currently used to amplify cDNA. One of the advantages of PCR-based methods is the ability to generate full-length cDNA. However, different PCR efficiency on particular sequences (for instance, GC content and snapback structure) may also be exponentially amplified, producing libraries with uneven coverage. On the other hand, while libraries generated by IVT can avoid PCR-induced sequence bias, specific sequences may be transcribed inefficiently, thus causing sequence drop-out or generating incomplete sequences. Several scRNA-Seq protocols have been published: Tang et al., STRT, SMART-seq, CEL-seq, RAGE-seq, Quartz-seq and C1-CAGE. These protocols differ in terms of strategies for reverse transcription, cDNA synthesis and amplification, and the possibility to accommodate sequence-specific barcodes (i.e. UMIs) or the ability to process pooled samples.
In 2017, two approaches were introduced to simultaneously measure single-cell mRNA and protein expression through oligonucleotide-labeled antibodies known as REAP-seq, and CITE-seq.
Applications
scRNA-Seq is becoming widely used across biological disciplines including Development, Neurology, Oncology, Autoimmune disease, and Infectious disease.
scRNA-Seq has provided considerable insight into the development of embryos and organisms, including the worm Caenorhabditis elegans, and the regenerative planarian Schmidtea mediterranea. The first vertebrate animals to be mapped in this way were Zebrafish and Xenopus laevis. In each case multiple stages of the embryo were studied, allowing the entire process of development to be mapped on a cell-by-cell basis. Science recognized these advances as the 2018 Breakthrough of the Year.
Experimental considerations
A variety of parameters are considered when designing and conducting RNA-Seq experiments:
- Tissue specificity: Gene expression varies within and between tissues, and RNA-Seq measures this mix of cell types. This may make it difficult to isolate the biological mechanism of interest. Single cell sequencing can be used to study each cell individually, mitigating this issue.
- Time dependence: Gene expression changes over time, and RNA-Seq only takes a snapshot. Time course experiments can be performed to observe changes in the transcriptome.
- Coverage (also known as depth): RNA harbors the same mutations observed in DNA, and detection requires deeper coverage. With high enough coverage, RNA-Seq can be used to estimate the expression of each allele. This may provide insight into phenomena such as imprinting or cis-regulatory effects. The depth of sequencing required for specific applications can be extrapolated from a pilot experiment.
- Data generation artifacts (also known as technical variance): The reagents (e.g., library preparation kit), personnel involved, and type of sequencer (e.g., Illumina, Pacific Biosciences) can result in technical artifacts that might be mis-interpreted as meaningful results. As with any scientific experiment, it is prudent to conduct RNA-Seq in a well controlled setting. If this is not possible or the study is a meta-analysis, another solution is to detect technical artifacts by inferring latent variables (typically principal component analysis or factor analysis) and subsequently correcting for these variables.
- Data management: A single RNA-Seq experiment in humans is usually 1-5 Gb (compressed), or more when including intermediate files. This large volume of data can pose storage issues. One solution is compressing the data using multi-purpose computational schemas (e.g., gzip) or genomics-specific schemas. The latter can be based on reference sequences or de novo. Another solution is to perform microarray experiments, which may be sufficient for hypothesis-driven work or replication studies (as opposed to exploratory research).
Analysis

Transcriptome assembly
Two methods are used to assign raw sequence reads to genomic features (i.e., assemble the transcriptome):
- De novo: This approach does not require a reference genome to reconstruct the transcriptome, and is typically used if the genome is unknown, incomplete, or substantially altered compared to the reference. Challenges when using short reads for de novo assembly include 1) determining which reads should be joined together into contiguous sequences (contigs), 2) robustness to sequencing errors and other artifacts, and 3) computational efficiency. The primary algorithm used for de novo assembly transitioned from overlap graphs, which identify all pair-wise overlaps between reads, to de Bruijn graphs, which break reads into sequences of length k and collapse all k-mers into a hash table. Overlap graphs were used with Sanger sequencing, but do not scale well to the millions of reads generated with RNA-Seq. Examples of assemblers that use de Bruijn graphs are Trinity, Oases (derived from the genome assembler Velvet), Bridger, and rnaSPAdes. Paired-end and long-read sequencing of the same sample can mitigate the deficits in short read sequencing by serving as a template or skeleton. Metrics to assess the quality of a de novo assembly include median contig length, number of contigs and N50.

- Genome guided: This approach relies on the same methods used for DNA alignment, with the additional complexity of aligning reads that cover non-continuous portions of the reference genome. These non-continuous reads are the result of sequencing spliced transcripts (see figure). Typically, alignment algorithms have two steps: 1) align short portions of the read (i.e., seed the genome), and 2) use dynamic programming to find an optimal alignment, sometimes in combination with known annotations. Software tools that use genome-guided alignment include Bowtie, TopHat (which builds on BowTie results to align splice junctions), Subread, STAR, HISAT2, and GMAP. The output of genome guided alignment (mapping) tools can be further used by tools such as Cufflinks or StringTie to reconstruct contiguous transcript sequences (i.e., a FASTA file). The quality of a genome guided assembly can be measured with both 1) de novo assembly metrics (e.g., N50) and 2) comparisons to known transcript, splice junction, genome, and protein sequences using precision, recall, or their combination (e.g., F1 score). In addition, in silico assessment could be performed using simulated reads.
A note on assembly quality: The current consensus is that 1) assembly quality can vary depending on which metric is used, 2) assembly tools that scored well in one species do not necessarily perform well in the other species, and 3) combining different approaches might be the most reliable.
Gene expression quantification
Expression is quantified to study cellular changes in response to external stimuli, differences between healthy and diseased states, and other research questions. Transcript levels are often used as a proxy for protein abundance, but these are often not equivalent due to post transcriptional events such as RNA interference and nonsense-mediated decay.
Expression is quantified by counting the number of reads that mapped to each locus in the transcriptome assembly step. Expression can be quantified for exons or genes using contigs or reference transcript annotations. These observed RNA-Seq read counts have been robustly validated against older technologies, including expression microarrays and qPCR. Tools that quantify counts are HTSeq, FeatureCounts, Rcount, maxcounts, FIXSEQ, and Cuffquant. These tools determine read counts from aligned RNA-Seq data, but alignment-free counts can also be obtained with Sailfish and Kallisto. The read counts are then converted into appropriate metrics for hypothesis testing, regressions, and other analyses. Parameters for this conversion are:
- Sequencing depth/coverage: Although depth is pre-specified when conducting multiple RNA-Seq experiments, it will still vary widely between experiments. Therefore, the total number of reads generated in a single experiment is typically normalized by converting counts to fragments, reads, or counts per million mapped reads (FPM, RPM, or CPM). The difference between RPM and FPM was historically derived during the evolution from single-end sequencing of fragments to paired-end sequencing. In single-end sequencing, there is only one read per fragment (i.e., RPM = FPM). In paired-end sequencing, there are two reads per fragment (i.e., RPM = 2 x FPM). Sequencing depth is sometimes referred to as library size, the number of intermediary cDNA molecules in the experiment.
- Gene length: Longer genes will have more fragments/reads/counts than shorter genes if transcript expression is the same. This is adjusted by dividing the FPM by the length of a feature (which can be a gene, transcript, or exon), resulting in the metric fragments per kilobase of feature per million mapped reads (FPKM). When looking at groups of features across samples, FPKM is converted to transcripts per million (TPM) by dividing each FPKM by the sum of FPKMs within a sample.
- Total sample RNA output: Because the same amount of RNA is extracted from each sample, samples with more total RNA will have less RNA per gene. These genes appear to have decreased expression, resulting in false positives in downstream analyses. Normalization strategies including quantile, DESeq2, TMM and Median Ratio attempt to account for this difference by comparing a set of non-differentially expressed genes between samples and scaling accordingly.
- Variance for each gene's expression: is modeled to account for sampling error (important for genes with low read counts), increase power, and decrease false positives. Variance can be estimated as a normal, Poisson, or negative binomial distribution and is frequently decomposed into technical and biological variance.
Spike-ins for absolute quantification and detection of genome-wide effects
RNA spike-ins are samples of RNA at known concentrations that can be used as gold standards in experimental design and during downstream analyses for absolute quantification and detection of genome-wide effects.
- Absolute quantification: Absolute quantification of gene expression is not possible with most RNA-Seq experiments, which quantify expression relative to all transcripts. It is possible by performing RNA-Seq with spike-ins, samples of RNA at known concentrations. After sequencing, read counts of spike-in sequences are used to determine the relationship between each gene's read counts and absolute quantities of biological fragments. In one example, this technique was used in Xenopus tropicalis embryos to determine transcription kinetics.
- Detection of genome-wide effects: Changes in global regulators including chromatin remodelers, transcription factors (e.g., MYC), acetyltransferase complexes, and nucleosome positioning are not congruent with normalization assumptions and spike-in controls can offer precise interpretation.
Differential expression
The simplest but often most powerful use of RNA-Seq is finding differences in gene expression between two or more conditions (e.g., treated vs not treated); this process is called differential expression. The outputs are frequently referred to as differentially expressed genes (DEGs) and these genes can either be up- or down-regulated (i.e., higher or lower in the condition of interest). There are many tools that perform differential expression. Most are run in R, Python, or the Unix command line. Commonly used tools include DESeq, edgeR, and voom+limma, all of which are available through R/Bioconductor. These are the common considerations when performing differential expression:
- Inputs: Differential expression inputs include (1) an RNA-Seq expression matrix (M genes x N samples) and (2) a design matrix containing experimental conditions for N samples. The simplest design matrix contains one column, corresponding to labels for the condition being tested. Other covariates (also referred to as factors, features, labels, or parameters) can include batch effects, known artifacts, and any metadata that might confound or mediate gene expression. In addition to known covariates, unknown covariates can also be estimated through unsupervised machine learning approaches including principal component, surrogate variable, and PEER analyses. Hidden variable analyses are often employed for human tissue RNA-Seq data, which typically have additional artifacts not captured in the metadata (e.g., ischemic time, sourcing from multiple institutions, underlying clinical traits, collecting data across many years with many personnel).
- Methods: Most tools use regression or non-parametric statistics to identify differentially expressed genes, and are either based on read counts mapped to a reference genome (DESeq2, limma, edgeR) or based on read counts derived from alignment-free quantification (sleuth, Cuffdiff, Ballgown). Following regression, most tools employ either familywise error rate (FWER) or false discovery rate (FDR) p-value adjustments to account for multiple hypotheses (in human studies, ~20,000 protein-coding genes or ~50,000 biotypes).
- Outputs: A typical output consists of rows corresponding to the number of genes and at least three columns, each gene's log fold change (log-transform of the ratio in expression between conditions, a measure of effect size), p-value, and p-value adjusted for multiple comparisons. Genes are defined as biologically meaningful if they pass cut-offs for effect size (log fold change) and statistical significance. These cut-offs should ideally be specified a priori, but the nature of RNA-Seq experiments is often exploratory so it is difficult to predict effect sizes and pertinent cut-offs ahead of time.
- Pitfalls: The raison d'etre for these complex methods is to avoid the myriad of pitfalls that can lead to statistical errors and misleading interpretations. Pitfalls include increased false positive rates (due to multiple comparisons), sample preparation artifacts, sample heterogeneity (like mixed genetic backgrounds), highly correlated samples, unaccounted for multi-level experimental designs, and poor experimental design. One notable pitfall is viewing results in Microsoft Excel without using the import feature to ensure that the gene names remain text. Although convenient, Excel automatically converts some gene names (SEPT1, DEC1, MARCH2) into dates or floating point numbers.
- Choice of tools and benchmarking: There are numerous efforts that compare the results of these tools, with DESeq2 tending to moderately outperform other methods. As with other methods, benchmarking consists of comparing tool outputs to each other and known gold standards.
Downstream analyses for a list of differentially expressed genes come in two flavors, validating observations and making biological inferences. Owing to the pitfalls of differential expression and RNA-Seq, important observations are replicated with (1) an orthogonal method in the same samples (like real-time PCR) or (2) another, sometimes pre-registered, experiment in a new cohort. The latter helps ensure generalizability and can typically be followed up with a meta-analysis of all the pooled cohorts. The most common method for obtaining higher-level biological understanding of the results is gene set enrichment analysis, although sometimes candidate gene approaches are employed. Gene set enrichment determines if the overlap between two gene sets is statistically significant, in this case the overlap between differentially expressed genes and gene sets from known pathways/databases (e.g., Gene Ontology, KEGG, Human Phenotype Ontology) or from complementary analyses in the same data (like co-expression networks). Common tools for gene set enrichment include web interfaces (e.g., ENRICHR, g:profiler, WEBGESTALT) and software packages. When evaluating enrichment results, one heuristic is to first look for enrichment of known biology as a sanity check and then expand the scope to look for novel biology.

Alternative splicing
RNA splicing is integral to eukaryotes and contributes significantly to protein regulation and diversity, occurring in >90% of human genes. There are multiple alternative splicing modes: exon skipping (most common splicing mode in humans and higher eukaryotes), mutually exclusive exons, alternative donor or acceptor sites, intron retention (most common splicing mode in plants, fungi, and protozoa), alternative transcription start site (promoter), and alternative polyadenylation. One goal of RNA-Seq is to identify alternative splicing events and test if they differ between conditions. Long-read sequencing captures the full transcript and thus minimizes many of issues in estimating isoform abundance, like ambiguous read mapping. For short-read RNA-Seq, there are multiple methods to detect alternative splicing that can be classified into three main groups:
- Count-based (also event-based, differential splicing): estimate exon retention. Examples are DEXSeq, MATS, and SeqGSEA.
- Isoform-based (also multi-read modules, differential isoform expression): estimate isoform abundance first, and then relative abundance between conditions. Examples are Cufflinks 2 and DiffSplice.
- Intron excision based: calculate alternative splicing using split reads. Examples are MAJIQ and Leafcutter.
Differential gene expression tools can also be used for differential isoform expression if isoforms are quantified ahead of time with other tools like RSEM.
Coexpression networks
Coexpression networks are data-derived representations of genes behaving in a similar way across tissues and experimental conditions. Their main purpose lies in hypothesis generation and guilt-by-association approaches for inferring functions of previously unknown genes. RNA-Seq data has been used to infer genes involved in specific pathways based on Pearson correlation, both in plants and mammals. The main advantage of RNA-Seq data in this kind of analysis over the microarray platforms is the capability to cover the entire transcriptome, therefore allowing the possibility to unravel more complete representations of the gene regulatory networks. Differential regulation of the splice isoforms of the same gene can be detected and used to predict their biological functions. Weighted gene co-expression network analysis has been successfully used to identify co-expression modules and intramodular hub genes based on RNA seq data. Co-expression modules may correspond to cell types or pathways. Highly connected intramodular hubs can be interpreted as representatives of their respective module. An eigengene is a weighted sum of expression of all genes in a module. Eigengenes are useful biomarkers (features) for diagnosis and prognosis. Variance-Stabilizing Transformation approaches for estimating correlation coefficients based on RNA seq data have been proposed.
Variant discovery
RNA-Seq captures DNA variation, including single nucleotide variants, small insertions/deletions. and structural variation. Variant calling in RNA-Seq is similar to DNA variant calling and often employs the same tools (including SAMtools mpileup and GATK HaplotypeCaller) with adjustments to account for splicing. One unique dimension for RNA variants is allele-specific expression (ASE): the variants from only one haplotype might be preferentially expressed due to regulatory effects including imprinting and expression quantitative trait loci, and noncoding rare variants. Limitations of RNA variant identification include that it only reflects expressed regions (in humans, <5% of the genome), could be subject to biases introduced by data processing (e.g., de novo transcriptome assemblies underestimate heterozygosity), and has lower quality when compared to direct DNA sequencing.
RNA editing (post-transcriptional alterations)
Having the matching genomic and transcriptomic sequences of an individual can help detect post-transcriptional edits (RNA editing). A post-transcriptional modification event is identified if the gene's transcript has an allele/variant not observed in the genomic data.

Fusion gene detection
Caused by different structural modifications in the genome, fusion genes have gained attention because of their relationship with cancer. The ability of RNA-Seq to analyze a sample's whole transcriptome in an unbiased fashion makes it an attractive tool to find these kinds of common events in cancer.
The idea follows from the process of aligning the short transcriptomic reads to a reference genome. Most of the short reads will fall within one complete exon, and a smaller but still large set would be expected to map to known exon-exon junctions. The remaining unmapped short reads would then be further analyzed to determine whether they match an exon-exon junction where the exons come from different genes. This would be evidence of a possible fusion event, however, because of the length of the reads, this could prove to be very noisy. An alternative approach is to use paired-end reads, when a potentially large number of paired reads would map each end to a different exon, giving better coverage of these events (see figure). Nonetheless, the end result consists of multiple and potentially novel combinations of genes providing an ideal starting point for further validation.
Copy number alteration
Copy number alteration (CNA) analyses are commonly used in cancer studies. Gain and loss of the genes have signalling pathway implications and are a key biomarker of molecular dysfunction in oncology. Calling the CNA information from RNA-Seq data is not straightforward because of the differences in gene expression, which lead to the read depth variance of different magnitudes across genes. Due to these difficulties, most of these analyses are usually done using whole-genome sequencing / whole-exome sequencing (WGS/WES). But advanced bioinformatics tools can call CNA from RNA-Seq.
Other emerging analysis and applications
The applications of RNA-Seq are growing day by day. Other new application of RNA-Seq includes detection of microbial contaminants, determining cell type abundance (cell type deconvolution), measuring the expression of TEs and Neoantigen prediction etc.
History
.png)
RNA-Seq was first developed in mid 2000s with the advent of next-generation sequencing technology. The first manuscripts that used RNA-Seq even without using the term includes those of prostate cancer cell lines (dated 2006), Medicago truncatula (2006), maize (2007), and Arabidopsis thaliana (2007), while the term "RNA-Seq" itself was first mentioned in 2008. The number of manuscripts referring to RNA-Seq in the title or abstract (Figure, blue line) is continuously increasing with 6754 manuscripts published in 2018. The intersection of RNA-Seq and medicine (Figure, gold line) has similar celerity.
Applications to medicine
RNA-Seq has the potential to identify new disease biology, profile biomarkers for clinical indications, infer druggable pathways, and make genetic diagnoses. These results could be further personalized for subgroups or even individual patients, potentially highlighting more effective prevention, diagnostics, and therapy. The feasibility of this approach is in part dictated by costs in money and time; a related limitation is the required team of specialists (bioinformaticians, physicians/clinicians, basic researchers, technicians) to fully interpret the huge amount of data generated by this analysis.
Large-scale sequencing efforts
A lot of emphasis has been given to RNA-Seq data after the Encyclopedia of DNA Elements (ENCODE) and The Cancer Genome Atlas (TCGA) projects have used this approach to characterize dozens of cell lines and thousands of primary tumor samples, respectively. ENCODE aimed to identify genome-wide regulatory regions in different cohort of cell lines and transcriptomic data are paramount to understand the downstream effect of those epigenetic and genetic regulatory layers. TCGA, instead, aimed to collect and analyze thousands of patient's samples from 30 different tumor types to understand the underlying mechanisms of malignant transformation and progression. In this context RNA-Seq data provide a unique snapshot of the transcriptomic status of the disease and look at an unbiased population of transcripts that allows the identification of novel transcripts, fusion transcripts and non-coding RNAs that could be undetected with different technologies.
See also
References
![]() This article was submitted to WikiJournal of Science for external academic peer review in 2019 (reviewer reports). The updated content was reintegrated into the Wikipedia page under a CC-BY-SA-3.0 license (2021). The version of record as reviewed is: Felix Richter, et al. (17 May 2021). "A broad introduction to RNA-Seq" (PDF). WikiJournal of Science. 4 (2): 4. doi:10.15347/WJS/2021.004. ISSN 2470-6345. Wikidata Q100146647.
This article was submitted to WikiJournal of Science for external academic peer review in 2019 (reviewer reports). The updated content was reintegrated into the Wikipedia page under a CC-BY-SA-3.0 license (2021). The version of record as reviewed is: Felix Richter, et al. (17 May 2021). "A broad introduction to RNA-Seq" (PDF). WikiJournal of Science. 4 (2): 4. doi:10.15347/WJS/2021.004. ISSN 2470-6345. Wikidata Q100146647.{{cite journal}}: CS1 maint: unflagged free DOI (link)
Further reading
- Taguchi Y (2019). "Comparative Transcriptomics Analysis". Encyclopedia of Bioinformatics and Computational Biology. pp. 814–818. doi:10.1016/B978-0-12-809633-8.20163-5. ISBN 978-0-12-811432-2. S2CID 65302519.
External links
- Cresko B, Voelker R, Small C (2001). Bassham S, Catchen J (eds.). "RNA-seqlopedia". University of Oregon.: a high-level guide to designing and implementing an RNA-Seq experiment.
This article uses material from the Wikipedia English article RNA-Seq, which is released under the Creative Commons Attribution-ShareAlike 3.0 license ("CC BY-SA 3.0"); additional terms may apply (view authors). Content is available under CC BY-SA 4.0 unless otherwise noted. Images, videos and audio are available under their respective licenses.
®Wikipedia is a registered trademark of the Wiki Foundation, Inc. Wiki English (DUHOCTRUNGQUOC.VN) is an independent company and has no affiliation with Wiki Foundation.