Non-Hispanic Whites
Non-Hispanic Whites, Non-Latino Whites, or more simply White Americans, are Americans classified by the United States census as white and not Hispanic.
According to the United States Census Bureau yearly estimates, as of July 1, 2022, Non-Hispanic whites make up about 59.3% of the U.S. population, or 197,639,521 people. The United States Census Bureau defines white to include European Americans, Middle Eastern Americans, and North African Americans. Americans of European ancestry are divided into various ethnic groups. More than half of the white population are German, Irish, English, French and Polish Americans. Many Americans are also the product of other European groups that migrated to parts of the US in the 19th and 20th centuries, as the bulk of immigrants from various countries in Northern, Central, Eastern, and Southeastern Europe, as well as the Caucasus region, migrated to the United States.
 Non-Hispanic whites by county in the United States | |
| Total population | |
|---|---|
| 203,890,513 (total) 61.6% of the total U.S. population (2020) 191,697,647 (white alone) 57.84% of the total US population (2020) and 12,192,866 (mixed race) 3.67% of the total U.S. population (2020) | |
| Regions with significant populations | |
| Throughout the United States, less common in Hawaii, California, New Mexico, Texas, and most major cities | |
| Languages | |
| Predominantly American English | |
| Religion | |
| 48% Protestant, 24% Unaffiliated, 19% Catholic, 3% Jewish, 2% Mormon, 2% Other Faiths (2014) | |
| Related ethnic groups | |
| European Americans European diaspora |
The Non-Hispanic White population was heavily derived from British, as well as French settlement of the Americas, in addition to settlement by other Europeans such as the Germans (see Pennsylvania Dutch), Swiss, Dutch, Austrians, and Swedes that began in the 17th century (see History of the United States). The early Spanish presence in the country contributed a certain degree of that ancestry to the white population in parts of the south and southwest, as many Americans of Isleño, Basque, or other colonial Spanish heritage do not necessarily identify as "Hispanic or Latino" on the census, or are interchangeable with the "non-Hispanic White" category, as they lack any ties to Latin America, or recent ties to Spain.
Continued growth since the early 19th century is attributed to sustained very high birth rates alongside relatively low death rates among settlers and natives alike. There has also been periodically massive immigration from European and West Asian countries, especially Germany, Ireland, the Netherlands, France, as well as Poland, Russia, Norway, Finland, the Czech Republic, the countries of the former Ottoman Empire (Turkey, Lebanon, and Syria), Portugal, Serbia, Croatia, Hungary, Ukraine, Armenia, Iran and more. Significant migration of Jews of European, North African, and Middle Eastern descent into the United States is also notable.
The classification is also typically used to refer to an English-speaking American, in distinction to Spanish speakers. In some parts of the country,[where?] the term Anglo-American is used to refer to non-Hispanic white English speakers as distinct from Spanish and Portuguese or Italian speakers although the term is more frequently used to refer to people of British or English descent and might include white people of Hispanic descent who no longer speak Spanish.
History

The first Europeans who came to present United States or Canada were Norse explorers around the year 1000[citation needed]; however, they were ultimately absorbed or killed off, leaving no permanent settlements behind. In the 1500s Spain founded several settlements in the contiguous United States, like San Agustín. Later, Pilgrims and colonists came in the 1600s along the East Coast, mainly from England, in search of economic opportunities and religious freedom. Over time emigrants from Europe settled the coastal regions developing a commercial economy. Between one-half and two-thirds of White immigrants to the American colonies between the 1630s and American Revolution had come as indentured servants. The total number of European immigrants to all 13 colonies before 1775 was about 500,000; of these 55,000 were involuntary prisoners. Of the 450,000 or so European arrivals who came voluntarily, an estimated 48% were indentured.
By the time of American Revolution there were about 2.5 million Whites in the colonies. The white population was largely of English, Irish, Scotch-Irish, Scottish, German, Dutch and French Huguenot descent at the time. Between the revolution and the 1820s there was relatively little immigration to the United States. Starting after the 1820s large scale migration to the United States began and lasted until the 1920s. Many of the newcomers were Catholics of Irish, Italian, and Polish descent which lead to a nativist backlash. Some Americans worried about the growing Catholic population and wanted to maintain the United States as an Anglo Saxon Protestant nation. Over the course of the 19th century, European mass emigration to the United States and high birthrates grew the white population.
After the American Revolution, white Americans settled the entire nation west of Appalachian Mountains, ultimately displacing the Natives and populating the entire country by the late 19th century. All immigration to the United States declined markedly between the mid-1920s until the 1960s due to a combination of immigration laws, the Great Depression, and World War II. Waves of Jewish, Syrian, and Lebanese immigration also occurred around this time.
Since 1965 white migration to the United States has been relatively minor compared to other racial and ethnic groups. During the 1990s there was a moderate increase from former communist countries of the Eastern Bloc and the Soviet Union. At the same time birthrates amongst Whites have fallen below replacement level. In 1980, non-Hispanic whites made up about 80 percent of the U.S. population, but that number has declined sharply in recent years.
Culture
White Americans have developed their own music, art, cuisine, fashion, and political economy largely based on a combination of traditional European ones. Today, the majority of White Americans are Protestants, although there are also large groups of Catholics and Jews throughout the population. Many Europeans often Anglicized their names and over time most Europeans adopted English as their primary language and intermarried with other white groups.
Demographics

Population
- Non-Hispanic White American population distribution over time
-
 1930 (Non-Mexican White)
 -
 1980
1980 -
 1990
1990 -
 2000
2000 -
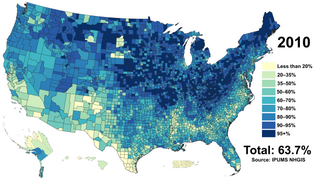 2010
2010 -
 2020
2020


Non-Hispanic Whites are the largest racial and ethnic group in America, being the majority of America's population at 59.3%, or 197,639,521 people. Although the percentage has been declining in the last few decades, from 89.5% in 1950 to 59.3% in 2022. According to generational data from the 2020 census, the racial diversity of each age group is increasing. White non-Hispanics make up 77% of the population over the age of 75, 67% of the population between the ages of 55 and 64, 55% of the population between the ages of 35 and 44, and just 50% of the population between the ages of 18 and 24. In actual Non-Hispanic whites have still been growing. From 2000 - 2010 the Non-Hispanic White population grew from 194,552,774 to 196,817,552. This was a growth of 1.2% over the 10-year period, due to population momentum. The population continued to grow to 196,817,552 in 2010 to 197,639,521 in 2022.
| Year | Total Population | Percentage of the American population | Actual Increase |
|---|---|---|---|
| 1980 | 180,256,103 | 79.6% | |
| 1990 |  188,128,296 188,128,296 |  75.6% 75.6% | 4.36% |
| 2000 | 194,552,774 | 69.1% | 3.41% |
| 2010 | 196,817,552 | 63.7% | 1.16% |
| 2022(est.) | 197,639,521 | 59.3% | 0.42% |

The reason for falling percentage of non-Latino/Hispanic white Americans in the last century is due to multiple factors:
1. Non-European Immigration. The United States has the largest number of immigrants in the world with the vast majority coming from countries where the population is of non-White and/or Latin American origin. Immigration to the United States from European countries has been in a steady decline since World War II averaging 56% of all immigrants in the 1950s and declining to 35% of all immigrants in the 1960s, 20% in the 1970s, 11% in the 1980s, 14% in the 1990s, and 13% in the 2000s. In 2009, approximately 90% of all immigrants came from non-European countries. The United States does receive a small number of non-Latino White immigrants, mainly from countries such as Canada, Poland, Russia, and the UK.
2. Intermarriage. The United States is seeing an unprecedented increase in intermarriage between the various racial and ethnic groups. In 2008, a record 14.6% of all new marriages in the United States were between spouses of a different race or ethnicity from one another. 9% of non-Latino whites who married in 2008 married either a non-White or Latino. Among all newlyweds in 2008, intermarried pairings were primarily white-Latino of any race (41%) as compared to white-Asian (15%), white-black (11%), and other combinations (33%). Other combinations consists of pairings between different minority groups, multi-racial people, and Native Indigenous Americans. The children of such unions would not automatically be classified as white non-Latino. One self-identifies his or her racial and/or ethnic category.
3. Methodology. In the 2000 Census, people were allowed to check more than one race in addition to choosing "Latino". There was strong opposition to this from some civil rights activists who feared that this would reduce the size of various racial minorities. The government responded by counting those who are white and of one minority race or ethnicity as minorities for the purposes of civil-rights monitoring and enforcement. Hence one could be 1/8th Black and still be counted as a minority. Also, because this does not apply to Latino origin (one is either Latino or not, but cannot be both Latino and non-Latino), the offspring of Latinos and non-Latinos are usually counted as Latino. In 2017, the Pew Research Center reported that high intermarriage rates and declining Latin American immigration has led to 11% of US adults with Latino ancestry (5.0 million people) to no longer identify as Latino. First-generation immigrants from Latin America identify themselves as "Latino" at a very high rate (97%), which slowly falls in each succeeding generation (in the second generation, to 92%; in the third, to 77%; and in the fourth, to 50%).
4. Attrition. Minority populations are younger than non-Latino Whites. The national median age in 2011 was 37.3 years, with non-Latino Whites having the oldest median age (42.3); by contrast, Latinos had the youngest median age (27.6). Non-Latino Blacks (32.9) and non-Latino Asians (35.9) also are younger than whites. In 2013, the Census Bureau reported that for the first time, due to the more advanced age profile of the non-Latino White population, non-Latino Whites died at a faster rate than non-Latino White births.
Births
In 2011, for the first time in American history, Non-Hispanic Whites accounted for fewer than half of the births in the country, accounting for 49.6% of total births. This increased to 51.5% in 2021, regaining the majority in the process. This is likely due to the birth rate declining among people of color. For example, between 1990 and 2010, the birth rate declined 29 percent among Blacks, 25 percent among Asians, 21 percent among Hispanics, but only 5 percent among White people. If this trend continues the White birth rate will surpass the Black birth rate in a few years.
A total of 1,887,656 babies were born in 2021, a 2.39% increase from 2020. Additionally, researchers found that the White fertility rate increased from 1.551 in 2020 to 1.598 in 2021, the first substantial rise since 2014. Although the exact reason of why the number of births rose in 2021 is unknown, a study showed that the uptick in births came among college-educated women and native-born Americans. Despite the increase, it is still below the replacement level of 2.100.
According to an analysis released in 2023 by William H. Frey, a senior fellow at the Brookings Institution, only 47 percent of American children are non-Hispanic white.
| Year | Number of Births | General Fertility Rate | Birth Rate | Total Fertility Rate |
|---|---|---|---|---|
| 2016 | 2,056,332 | 58.8 | 10.5 | 1.719 |
| 2017 | 1,992,461 | 57.2 | 10.2 | 1.666 |
| 2018 | 1,956,413 | 56.3 | 10.0 | 1.640 |
| 2019 | 1,915,912 | 55.3 | 9.8 | 1.610 |
| 2020 | 1,843,432 | 53.0 | 9.4 | 1.551 |
| 2021 | 1,887,656 | 54.4 | 9.7 | 1.598 |
Religion
Population
In 2014, the religious majority among Whites were Christians at 70%, more specifically Protestants at 48%. But, there are also large groups of Catholics and Jews. Furthermore, 34% of White Americans go to religious services weekly, and an additional 32% go to religious services once or twice a month. Although historically, White Christians made up the majority of the American population, the number of White Christians has now plateaued at about 44% of the country's population.
Population by settlement
| State/Territory | Pop 1990 | % pop 1990 | Pop 2000 | % pop 2000 | Pop 2010 | % pop 2010 | Pop 2020 | % pop 2020 | % growth 2010-2020 | % pop 1990-2020 |
|---|---|---|---|---|---|---|---|---|---|---|
 Alabama Alabama | 2,960,167 | 73.3% | 3,125,819 | 70.3% | 3,204,402 | 67.0% | 3,171,351 | 63.1% | -1.0% | -11.0% |
 Alaska Alaska | 406,722 | 73.9% | 423,788 | 67.6% | 455,320 | 64.1% | 421,758 | 57.5% | -7.4% | -22.2% |
 Arizona Arizona | 2,626,185 | 71.7% | 3,274,258 | 63.8% | 3,695,647 | 57.8% | 3,816,547 | 53.4% | +3.3% | -25.5% |
 Arkansas Arkansas | 1,933,082 | 82.2% | 2,100,135 | 78.6% | 2,173,469 | 74.5% | 2,063,550 | 68.5% | -5.0% | -16.7% |
 California California | 17,029,126 | 57.2% | 15,816,790 | 46.7% | 14,956,253 | 40.1% | 13,714,587 | 34.7% | -8.3% | -39.3% |
 Colorado Colorado | 2,658,945 | 80.7% | 3,202,880 | 74.5% | 3,520,793 | 70.0% | 3,760,663 | 65.1% | +6.8% | -19.3% |
 Connecticut Connecticut | 2,754,184 | 83.8% | 2,638,845 | 77.5% | 2,546,262 | 71.2% | 2,279,232 | 63.2% | -10.5% | -24.6% |
 Delaware Delaware | 528,092 | 79.3% | 567,973 | 72.5% | 586,752 | 65.3% | 579,851 | 58.6% | -1.2% | -26.1% |
 District of Columbia District of Columbia | 166,131 | 27.4% | 159,178 | 27.8% | 209,464 | 34.8% | 261,771 | 38.0% | +25.0% | +38.7% |
 Florida Florida | 9,475,326 | 73.2% | 10,458,509 | 65.4% | 10,884,722 | 57.9% | 11,100,503 | 51.5% | +1.2% | -29.6% |
 Georgia Georgia | 4,543,425 | 70.1% | 5,128,661 | 62.6% | 5,413,920 | 55.9% | 5,362,156 | 50.1% | -1.0% | -28.5% |
 Hawaii Hawaii | 347,644 | 31.4% | 277,091 | 22.9% | 309,343 | 22.7% | 314,365 | 21.6% | +1.6% | -31.2% |
 Idaho Idaho | 928,661 | 92.2% | 1,139,291 | 88.0% | 1,316,243 | 84.0% | 1,450,523 | 78.9% | +10.2% | -11.4% |
 Illinois Illinois | 8,550,208 | 74.8% | 8,424,140 | 67.8% | 8,167,753 | 63.7% | 7,472,751 | 58.3% | -8.5% | -22.1% |
 Indiana Indiana | 4,965,242 | 89.6% | 5,219,373 | 85.8% | 5,286,453 | 81.5% | 5,121,004 | 75.5% | -0.4% | -15.7% |
 Iowa Iowa | 2,663,840 | 95.9% | 2,710,344 | 92.6% | 2,701,123 | 88.7% | 2,638,201 | 82.7% | -6.8% | -10.9% |
 Kansas Kansas | 2,190,524 | 88.4% | 2,233,997 | 83.1% | 2,230,539 | 78.2% | 2,122,575 | 72.3% | -4.9% | -18.3% |
 Kentucky Kentucky | 3,378,022 | 91.7% | 3,608,013 | 89.3% | 3,745,655 | 86.3% | 3,664,764 | 81.3% | -2.2% | -11.3% |
 Louisiana Louisiana | 2,776,022 | 65.8% | 2,794,391 | 62.5% | 2,734,884 | 60.3% | 2,596,702 | 55.8% | -5.1% | -15.2% |
 Maine Maine | 1,203,357 | 98.0% | 1,230,297 | 96.5% | 1,254,297 | 94.4% | 1,228,264 | 90.2% | -2.1% | -8.0% |
 Maryland Maryland | 3,326,109 | 69.6% | 3,286,547 | 62.1% | 3,157,958 | 54.7% | 2,913,782 | 47.2% | -7.7% | -32.2% |
 Massachusetts Massachusetts | 5,280,292 | 87.8% | 5,198,359 | 81.9% | 4,984,800 | 76.1% | 4,748,897 | 67.6% | -4.7% | -23.0% |
 Michigan Michigan | 7,649,951 | 82.3% | 7,806,691 | 78.6% | 7,569,939 | 76.6% | 7,295,651 | 72.4% | -3.6% | -12% |
 Minnesota Minnesota | 4,101,266 | 93.7% | 4,337,143 | 88.2% | 4,405,142 | 83.1% | 4,353,880 | 76.3% | -1.2% | -15.3% |
 Mississippi Mississippi | 1,624,198 | 63.1% | 1,727,908 | 60.7% | 1,722,287 | 58.0% | 1,639,077 | 55.4% | -4.8% | -12.2% |
 Missouri Missouri | 4,448,465 | 86.9% | 4,686,474 | 83.8% | 4,850,748 | 81.0% | 4,663,907 | 75.8% | -3.9% | -12.8% |
 Montana Montana | 733,878 | 91.8% | 807,823 | 89.5% | 868,628 | 87.8% | 901,318 | 83.1% | +3.8% | -9.5% |
 Nebraska Nebraska | 1,460,095 | 92.5% | 1,494,494 | 87.3% | 1,499,753 | 82.1% | 1,484,687 | 75.7% | -1.0% | -28.2% |
 Nevada Nevada | 1,929,661 | 78.7% | 1,303,001 | 65.2% | 1,462,081 | 54.1% | 1,425,952 | 45.9% | -3.5% | -41.7% |
 New Hampshire New Hampshire | 1,079,484 | 97.3% | 1,175,252 | 95.1% | 1,215,050 | 92.3% | 1,200,649 | 87.2% | -1.2% | -10.4% |
 New Jersey New Jersey | 5,718,966 | 74.0% | 5,557,209 | 66.0% | 5,214,878 | 59.3% | 4,816,381 | 51.9% | -7.6% | -30% |
 New Mexico New Mexico | 764,164 | 50.4% | 813,495 | 44.7% | 833,810 | 40.5% | 772,952 | 36.5% | -7.3% | -26.6% |
 New York New York | 12,460,189 | 69.3% | 11,760,981 | 62.0% | 11,304,247 | 58.3% | 10,598,907 | 52.5% | -6.4% | -24.2% |
 North Carolina North Carolina | 4,971,127 | 75.0% | 5,647,155 | 70.2% | 6,223,995 | 65.3% | 6,312,148 | 60.5% | +1.4% | -19.3 pp |
 North Dakota North Dakota | 601,592 | 94.2% | 589,149 | 91.7% | 598,007 | 88.9% | 636,160 | 81.7% | +6.4% | -13.1% |
 Ohio Ohio | 9,444,622 | 87.1% | 9,538,111 | 84.0% | 9,359,263 | 81.1% | 8,954,135 | 75.9% | -4.3% | -12.9% |
 Oklahoma Oklahoma | 2,547,588 | 81.0% | 2,556,368 | 74.1% | 2,575,381 | 68.7% | 2,407,188 | 60.8% | -6.5% | -25% |
 Oregon Oregon | 2,579,732 | 90.8% | 2,857,616 | 83.5% | 3,005,848 | 78.5% | 3,036,158 | 71.7% | +1.0% | -21.0% |
 Pennsylvania Pennsylvania | 10,422,058 | 87.7% | 10,322,455 | 84.1% | 10,094,652 | 79.5% | 9,553,417 | 73.5% | -5.4% | -16.2% |
 Rhode Island Rhode Island | 896,109 | 89.3% | 858,433 | 81.9% | 803,685 | 76.4% | 754,050 | 68.7% | -6.2% | -23.1% |
 South Carolina South Carolina | 2,390,056 | 68.5% | 2,652,291 | 66.1% | 2,962,740 | 64.1% | 3,178,552 | 62.1% | +7.3% | -9.3% |
 South Dakota South Dakota | 634,788 | 91.2% | 664,585 | 88.0% | 689,502 | 84.7% | 705,583 | 79.6% | +2.3% | -12.7% |
 Tennessee Tennessee | 4,027,631 | 82.6% | 4,505,930 | 79.2% | 4,800,782 | 75.6% | 4,900,246 | 70.9% | +2.1% | -14.2% |
 Texas Texas | 10,291,680 | 60.6% | 10,933,313 | 52.4% | 11,397,345 | 45.3% | 11,584,597 | 39.8% | +1.6% | -34.5% |
 Utah Utah | 1,571,254 | 91.2% | 1,904,265 | 85.3% | 2,221,719 | 80.4% | 2,465,355 | 75.4% | +11.0% | -17.3% |
 Vermont Vermont | 552,184 | 98.1% | 585,431 | 96.2% | 590,223 | 94.3% | 573,201 | 89.1% | -2.9% | -9.2% |
 Virginia Virginia | 4,701,650 | 76.0% | 4,965,637 | 70.2% | 5,186,450 | 64.8% | 5,058,363 | 58.6% | -2.5% | -29.9% |
 Washington Washington | 4,221,622 | 86.7% | 4,652,490 | 78.9% | 4,876,804 | 72.5% | 4,918,820 | 63.8% | +0.9% | -26.4% |
 West Virginia West Virginia | 1,718,896 | 95.8% | 1,709,966 | 94.6% | 1,726,256 | 93.2% | 1,598,834 | 89.1% | -7.4% | -7.0% |
 Wisconsin Wisconsin | 4,464,677 | 91.3% | 4,681,630 | 87.3% | 4,738,411 | 83.3% | 4,634,018 | 78.6% | -2.2% | -13.9% |
 Wyoming Wyoming | 412,711 | 91.0% | 438,799 | 88.9% | 483,874 | 85.9% | 469,664 | 81.4% | -2.9% | -10.5% |
 American Samoa American Samoa | 682 | 1.2% | 611 | 1.1% | ||||||
 Guam Guam | 10,666 | 6.9% | 11,001 | 6.9% | ||||||
 Northern Mariana Islands Northern Mariana Islands | 1,274 | 1.8% | 916 | 1.7% | ||||||
 Puerto Rico Puerto Rico | 33,966 | 0.9% | 26,946 | 0.7% | 24,548 | 0.8% | -8.9% | |||
 U.S. Virgin Islands U.S. Virgin Islands | 8,580 | 7.9% | 3,830 | 3.6% | ||||||
 United States of America United States of America | 188,128,296 | 75.6% | 194,552,774 | 69.1% | 196,817,552 | 63.7% | 191,697,647 | 57.8% | -2.6% | –23.5% |
In 2020, in 36 out of the 50 US states, non-Latino whites made up a greater percentage of the state's population than the US overall share of 57.8%; however, the 14 states with greater shares of non-whites include the four most populous states (California, Texas, New York, and Florida). The total non-Latino white population shrunk between 2010 and 2020 in 34 out of the 50 states, and the relative share of non-Latino whites in the overall state population has declined in all 50 states during that same time period.[citation needed]
As of 2020, six states are majority-minority: Hawaii, California, New Mexico, Texas, Nevada, and Maryland. All of these states saw larger declines in the relative share of their non-Latino white populations between 1990 and 2020 than the national average of -23.5% with Nevada dropping by -41.7%, California by -39.3% and Texas by -34.5%.[citation needed]
Historical population by state or territory
| State/Territory | 1910 | 1920 | 1930 | 1940 | 1950 | 1960 | 1970 | 1980 | 1990 | 2000 | 2010 | 2020 |
|---|---|---|---|---|---|---|---|---|---|---|---|---|
| Alabama | 65.3% | 73.3% | 73.3% | 73.3% | 70.3% | 67.0% | 63.1% | |||||
| Alaska | 48.3% | 77.2% | 75.8% | 73.9% | 67.6% | 64.1% | 57.5% | |||||
| Arizona | 59.9% | 60.7% | 60.6% | 65.1% | 74.3% | 74.5% | 71.7% | 63.8% | 57.8% | 53.4% | ||
| Arkansas | 75.2% | 81.0% | 82.2% | 82.2% | 78.6% | 74.5% | 68.5% | |||||
| California | 93% | 91.7% | 88.7% | 89.5% | 76.3% | 66.6% | 57.2% | 46.7% | 40.1% | 34.7% | ||
| Colorado | 97.6% | 96.8% | 92.8% | 90.3% | 84.6% | 82.7% | 80.7% | 74.5% | 70.0% | 65.1% | ||
| Connecticut | 97.9% | 91.4% | 88.0% | 83.8% | 77.5% | 71.2% | 63.2% | |||||
| Delaware | 86.4% | 84.1% | 81.3% | 79.3% | 72.5% | 65.3% | 58.6% | |||||
| District of Columbia | 71.4% | 26.5% | 25.7% | 27.4% | 27.8% | 34.8% | 38.0% | |||||
| Florida | 58.9% | 71.5% | 77.9% | 76.7% | 73.2% | 65.4% | 57.9% | 51.5% | ||||
| Georgia | 65.2% | 73.4% | 71.6% | 70.1% | 62.6% | 55.9% | 50.1% | |||||
| Hawaii | 31.5% | 38.0% | 31.1% | 31.4% | 22.9% | 22.7% | 21.6% | |||||
| Idaho | 98.4% | 95.9% | 93.9% | 92.2% | 88.0% | 84.0% | 78.9% | |||||
| Illinois | 94.7% | 83.5% | 78.0% | 74.8% | 67.8% | 63.7% | 58.3% | |||||
| Indiana | 96.3% | 91.7% | 90.2% | 89.6% | 85.8% | 81.5% | 75.5% | |||||
| Iowa | 99.2% | 98.0% | 96.9% | 95.9% | 92.6% | 88.7% | 82.7% | |||||
| Kansas | 95.6% | 92.7% | 90.5% | 88.4% | 83.1% | 78.2% | 72.2% | |||||
| Kentucky | 92.5% | 92.4% | 91.7% | 91.7% | 89.3% | 86.3% | 81.3% | |||||
| Louisiana | 63.7% | 68.2% | 67.6% | 65.8% | 62.5% | 60.3% | 55.8% | |||||
| Maine | 99.7% | 99.1% | 98.3% | 98.0% | 96.5% | 94.4% | 90.2% | |||||
| Maryland | 83.3% | 80.4% | 73.9% | 69.6% | 62.1% | 54.7% | 47.2% | |||||
| Massachusetts | 98.6% | 95.4% | 92.3% | 87.8% | 81.9% | 76.1% | 67.6% | |||||
| Michigan | 95.7% | 87.1% | 84.1% | 82.3% | 78.6% | 76.6% | 72.4% | |||||
| Minnesota | 99.0% | 97.7% | 96.1% | 93.7% | 88.2% | 83.1% | 76.3% | |||||
| Mississippi | 50.6% | 62.6% | 63.6% | 63.1% | 60.7% | 58.0% | 55.4% | |||||
| Missouri | 93.4% | 88.6% | 87.7% | 86.9% | 83.8% | 81.0% | 75.8% | |||||
| Montana | 96.2% | 94.7% | 93.4% | 91.8% | 89.5% | 87.8% | 83.1% | |||||
| Nebraska | 98.2% | 95.2% | 94.0% | 92.5% | 87.3% | 82.1% | 75.7% | |||||
| Nevada | 89.7% | 91.6% | 86.7% | 83.2% | 78.7% | 65.2% | 54.1% | 45.9% | ||||
| New Hampshire | 99.9% | 99.1% | 98.4% | 97.3% | 95.1% | 92.3% | 87.2% | |||||
| New Jersey | 94.3% | 84.7% | 79.1% | 74.0% | 66.0% | 59.3% | 51.8% | |||||
| New Mexico | 86.6% | 50.9% | 53.8% | 52.6% | 50.4% | 44.7% | 40.5% | 36.5% | ||||
| New York | 94.6% | 80.1% | 75.0% | 69.3% | 62.0% | 58.3% | 52.5% | |||||
| North Carolina | 71.9% | 76.5% | 75.3% | 75.0% | 70.2% | 65.3% | 60.5% | |||||
| North Dakota | 98.3% | 96.9% | 95.5% | 94.2% | 91.7% | 88.9% | 81.7% | |||||
| Ohio | 95.0% | 89.8% | 88.2% | 87.1% | 84.0% | 81.1% | 75.9% | |||||
| Oklahoma | 87% | 89.9% | 88.1% | 85.0% | 81.0% | 74.1% | 68.7% | 60.8% | ||||
| Oregon | 98.6% | 95.8% | 93.3% | 90.8% | 83.5% | 78.5% | 71.7% | |||||
| Pennsylvania | 95.1% | 90.3% | 89.1% | 87.7% | 84.1% | 79.5% | 73.5% | |||||
| Rhode Island | 98.3% | 96.1% | 93.4% | 89.3% | 81.9% | 76.4% | 68.7% | |||||
| South Carolina | 57.1% | 69.0% | 68.3% | 68.5% | 66.1% | 64.1% | 62.1% | |||||
| South Dakota | 96.2% | 94.6% | 92.3% | 91.2% | 88.0% | 84.7% | 79.6% | |||||
| Tennessee | 82.5% | 83.7% | 83.1% | 82.6% | 79.2% | 75.6% | 70.9% | |||||
| Texas | 76.4% | 75.7% | 73.5% | 74.1% | 69.6% | 65.7% | 60.6% | 52.4% | 45.3% | 39.7% | ||
| Utah | 98.2% | 93.6% | 92.4% | 91.2% | 85.3% | 80.4% | 75.4% | |||||
| Vermont | 99.7% | 99.2% | 98.5% | 98.1% | 96.2% | 94.3% | 89.1% | |||||
| Virginia | 75.3% | 80.1% | 78.2% | 76.0% | 70.2% | 64.8% | 58.6% | |||||
| Washington | 97.7% | 93.6% | 90.2% | 86.7% | 78.9% | 72.5% | 63.8% | |||||
| West Virginia | 93.7% | 95.7% | 95.6% | 95.8% | 94.6% | 93.2% | 89.1% | |||||
| Wisconsin | 99.2% | 95.6% | 93.6% | 91.3% | 87.3% | 83.3% | 78.6% | |||||
| Wyoming | 95.9% | 92.1% | 92.0% | 91.0% | 88.9% | 85.9% | 81.4% | |||||
| Puerto Rico | 0.9% | 0.7% | 0.8% | |||||||||
| United States of America | 88.4% | 89% | 88.7% | 88.4% | 83.5% | 79.6% | 75.6% | 69.1% | 63.7% | 57.8% |
See also
- Race and ethnicity in the United States census
- Anglo
- Emigration from Europe
- European Americans
- Stereotypes of white Americans
- White Americans
- White Anglo-Saxon Protestant
- White ethnic
- White Latino Americans
- White Southerners
- White demographic decline
- List of U.S. states by non-Hispanic white population
- List of U.S. cities with non-Hispanic white plurality populations in 2010
References
This article uses material from the Wikipedia English article Non-Hispanic whites, which is released under the Creative Commons Attribution-ShareAlike 3.0 license ("CC BY-SA 3.0"); additional terms may apply (view authors). Content is available under CC BY-SA 4.0 unless otherwise noted. Images, videos and audio are available under their respective licenses.
®Wikipedia is a registered trademark of the Wiki Foundation, Inc. Wiki English (DUHOCTRUNGQUOC.VN) is an independent company and has no affiliation with Wiki Foundation.