List Of Administrative Divisions Of Greater China By Human Development Index
This is a list of the first-level administrative divisions of the People's Republic of China (PRC), including all provinces, autonomous regions, municipalities, and special administrative regions in order of their Human Development Index (HDI), along with the Republic of China (ROC, Taiwan).
The subnational and national average figures for the PRC/ROC division are mainly derived from the Subnational Human Development Index (SHDI), published by the Global Data Lab at Radboud University. The index does not cover Macau, a special administrative region of the PRC. Only divisions of Mainland China are given ranking numbers in the list as the national HDI for China, which is calculated by the annual UNDP Human Development Report, is exclusively applied to the mainland.
List of administrative divisions by HDI
.svg)
The Subnational Human Development Database (2021 data)
| Rank | Provincial-level division / National average | HDI (2021) |
|---|---|---|
| Very high human development | ||
| – |  Hong Kong Hong Kong | 0.952 |
| – |  Republic of China (Taiwan) Republic of China (Taiwan) | 0.926 |
| – |  Macau Macau | 0.922 (2019) |
| 1 | Beijing | 0.907 |
| 2 | Shanghai | 0.880 |
| 3 | Tianjin | 0.844 |
| 4 | Jiangsu | 0.810 |
| 5 | Zhejiang | 0.801 |
| High human development | ||
| 6 | Guangdong | 0.799 |
| 7 | Liaoning | 0.780 |
| 8 | Inner Mongolia | 0.777 |
| 9 | Fujian | 0.775 |
| Hubei | ||
| 11 | Chongqing | 0.774 |
| 12 | Hainan | 0.769 |
| 13 | Shaanxi | 0.768 |
| – |  People's Republic of China (Average) People's Republic of China (Average) | 0.768 |
| 14 | Shandong | 0.765 |
| 15 | Hunan | 0.762 |
| 16 | Shanxi | 0.758 |
| 17 | Jilin | 0.751 |
| 18 | Henan | 0.748 |
| 19 | Jiangxi | 0.747 |
| 20 | Anhui | 0.744 |
| Hebei | ||
| 22 | Heilongjiang | 0.743 |
| 23 | Sichuan | 0.740 |
| 24 | Xinjiang | 0.738 |
| 25 | Guangxi | 0.734 |
| Ningxia | ||
| Medium human development | ||
| 27 | Yunnan | 0.697 |
| 28 | Qinghai | 0.695 |
| 29 | Gansu | 0.693 |
| 30 | Guizhou | 0.690 |
| 31 | Tibet | 0.614 |
Notes:
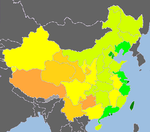
Trend
| Legend | ||||
|---|---|---|---|---|
| Very High human development 0.900 and above 0.850–0.899 0.800–0.849 | High human development 0.750–0.799 0.700–0.749 | Medium human development 0.650–0.699 0.600–0.649 0.550–0.599 | Data unavailable | |
- 2010-2014 HDI
-
 2014 data
 -
 2010 data


| Legend | ||||
|---|---|---|---|---|
| Very High human development 0.900–0.949 | High human development 0.850–0.899 0.800–0.849 | Medium human development 0.750–0.799 0.700–0.749 0.650–0.699 0.600–0.649 0.550–0.599 0.500–0.549 | Low human development 0.450–0.499 0.400–0.449 0.350–0.399 | Data unavailable |
- 1982-2008 HDI
-
 2008 data
 -
 2005 data
 -
 2003 data
 -
 1999 data
 -
 1997 data
 -
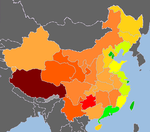 1995 data
 -
 1990 data
 -
 1982 data


See also

References
This article uses material from the Wikipedia English article List of administrative divisions of Greater China by Human Development Index, which is released under the Creative Commons Attribution-ShareAlike 3.0 license ("CC BY-SA 3.0"); additional terms may apply (view authors). Content is available under CC BY-SA 4.0 unless otherwise noted. Images, videos and audio are available under their respective licenses.
®Wikipedia is a registered trademark of the Wiki Foundation, Inc. Wiki English (DUHOCTRUNGQUOC.VN) is an independent company and has no affiliation with Wiki Foundation.