File:US demographic composition population pyramid.gif
Jump to navigation
Jump to search

Size of this preview: 750 × 600 pixels. Other resolutions: 300 × 240 pixels | 600 × 480 pixels | 900 × 720 pixels.
Original file (900 × 720 pixels, file size: 5.32 MB, MIME type: image/gif, looped, 121 frames, 26 s)
Captions
Captions
US demographic composition population pyramid
Summary[edit]
| Description |
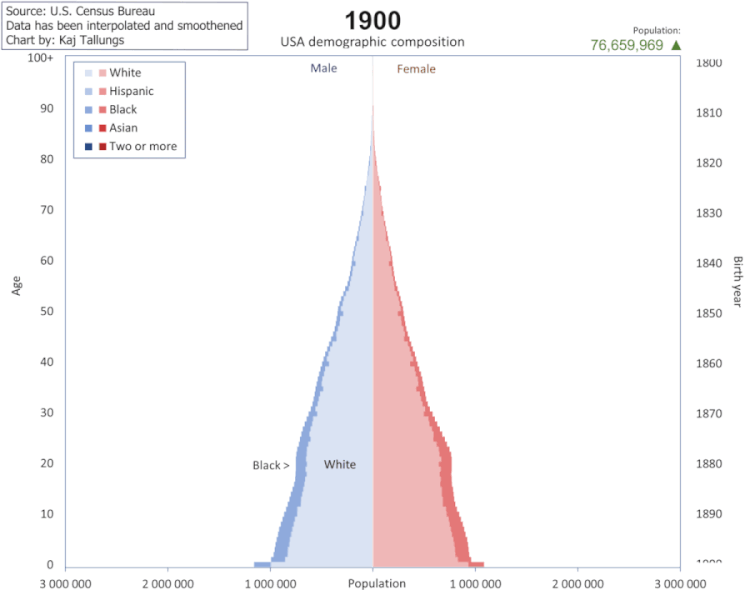
English: Stitched together from multiple U.S. Census Bureau tables. With NCHS data for the infant mortality rate since I wanted each year to start with total amount of children born in a cohort, so that the lowest bar actually represents all births, and the drop represents all infant mortality.
The U.S. Census Bureau data was gathered through multiple sources depending on time and type of data. Infant mortality rate:
Population total:
Race data:
Notes:
|
| Date | |
| Source | Own work, see description for source |
| Author | Kaj Tallungs |
Licensing[edit]
I, the copyright holder of this work, hereby publish it under the following license:
This file is licensed under the Creative Commons Attribution-Share Alike 4.0 International license.
- You are free:
- to share – to copy, distribute and transmit the work
- to remix – to adapt the work
- Under the following conditions:
- attribution – You must give appropriate credit, provide a link to the license, and indicate if changes were made. You may do so in any reasonable manner, but not in any way that suggests the licensor endorses you or your use.
- share alike – If you remix, transform, or build upon the material, you must distribute your contributions under the same or compatible license as the original.
File history
Click on a date/time to view the file as it appeared at that time.
| Date/Time | Thumbnail | Dimensions | User | Comment | |
|---|---|---|---|---|---|
| current | 07:33, 2 January 2023 | | 900 × 720 (5.32 MB) | Tallungs (talk | contribs) | Higher resolution |
| 04:08, 30 August 2022 |  | 450 × 360 (1.88 MB) | Tallungs (talk | contribs) | Uploaded own work with UploadWizard |
You cannot overwrite this file.
File usage on Commons
The following 2 pages use this file:
File usage on other wikis
The following other wikis use this file:
- Usage on de.wikipedia.org
- Usage on en.wikipedia.org
- Usage on ru.wikipedia.org