File:Temporal variations of forest resilience and its key drivers.webp
Jump to navigation
Jump to search

Size of this PNG preview of this WEBP file: 770 × 600 pixels. Other resolutions: 308 × 240 pixels | 616 × 480 pixels | 986 × 768 pixels | 1,280 × 997 pixels | 2,116 × 1,648 pixels.
Original file (2,116 × 1,648 pixels, file size: 302 KB, MIME type: image/webp)
Captions
Captions
From the study "Emerging signals of declining forest resilience under climate change"
Summary[edit]
| Description |
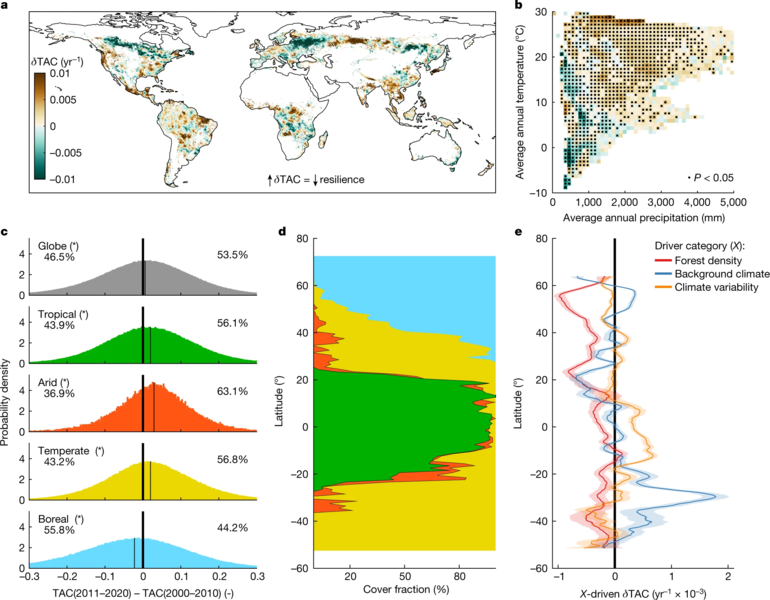
English: "a, Spatial map of the temporal trend of TAC (δTAC). Positive δTAC values (for example, tropical forests) suggest a reduction in recovery rates and thus a decline in resilience, and vice versa for negative δTAC values (for example, boreal forests). The values are averaged over a 1° × 1° moving window for visual purposes. b, δTAC as in a binned as a function of climatological temperature and precipitation. The black dots indicate bins with average values that are statistically different from zero (two-sided Student’s t-test; P value ≤ 0.05). c, Frequency distribution of the differences in TAC computed for two independent temporal windows (2011–2020 minus 2000–2010) and shown separately for different climate regions. The numbers refer to the percentage of the observations lower and greater than zero; the asterisks indicate distributions with averages that are statistically different from zero (two-sided Student’s t-test; P value ≤ 0.05). The thin vertical line in each plot shows the distribution average. d, The cover fraction corresponding to each climate region and colour code reported in c and shown over the latitudinal gradient. e, The zonal average of the trend in TAC (δTAC) as determined by the three drivers (X) at 5° latitudinal resolution and the corresponding 95% confidence interval shown as a coloured line and shaded band, respectively. The colours reflect the three different driver categories: forest density, background climate and climate variability." |
| Date | |
| Source | https://www.nature.com/articles/s41586-022-04959-9 |
| Author | Authors of the study: Giovanni Forzieri, Vasilis Dakos, Nate G. McDowell, Alkama Ramdane & Alessandro Cescatti |
Licensing[edit]
This file is licensed under the Creative Commons Attribution 4.0 International license.
- You are free:
- to share – to copy, distribute and transmit the work
- to remix – to adapt the work
- Under the following conditions:
- attribution – You must give appropriate credit, provide a link to the license, and indicate if changes were made. You may do so in any reasonable manner, but not in any way that suggests the licensor endorses you or your use.
File history
Click on a date/time to view the file as it appeared at that time.
| Date/Time | Thumbnail | Dimensions | User | Comment | |
|---|---|---|---|---|---|
| current | 21:43, 27 August 2022 | | 2,116 × 1,648 (302 KB) | Prototyperspective (talk | contribs) | Uploaded a work by Authors of the study: Giovanni Forzieri, Vasilis Dakos, Nate G. McDowell, Alkama Ramdane & Alessandro Cescatti from https://www.nature.com/articles/s41586-022-04959-9 with UploadWizard |
You cannot overwrite this file.
File usage on Commons
There are no pages that use this file.
File usage on other wikis
The following other wikis use this file:
- Usage on cs.wikipedia.org
- Usage on en.wikipedia.org
- Usage on fa.wikipedia.org
- Usage on ig.wikipedia.org
- Usage on zh.wikipedia.org