File:PRC Population Changes 2000-2010.svg
Jump to navigation
Jump to search

Size of this PNG preview of this SVG file: 735 × 599 pixels. Other resolutions: 294 × 240 pixels | 589 × 480 pixels | 942 × 768 pixels | 1,256 × 1,024 pixels | 2,511 × 2,048 pixels | 857 × 699 pixels.
Original file (SVG file, nominally 857 × 699 pixels, file size: 144 KB)
Captions
Captions
Add a one-line explanation of what this file represents
Summary[edit]
| Description |
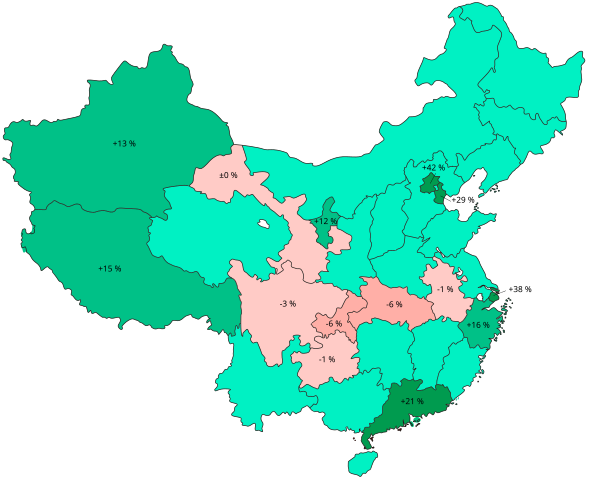
Deutsch: Bevölkerungsänderungen nach administrativen Einheiten in der Volksrepublik China 2000-2010 in Prozent.
≤ -5,0 %
>-5,0–0,0 %
>0,0–1,0 %
>1,0–20,0 % %
>20,0 % English: Population changes in percent according to administrative units in the People’s Republic of China between 2000 and 2010. |
||
| Date | |||
| Source |
This file was derived from: PRC Population Density.svg |
||
| Author | Furfur | ||
| Permission (Reusing this file) |
I, the copyright holder of this work, hereby publish it under the following licenses:
This file is licensed under the Creative Commons Attribution-Share Alike 4.0 International license.
You may select the license of your choice. |
||
| SVG development | This map was created with Adobe Illustrator. |

File history
Click on a date/time to view the file as it appeared at that time.
| Date/Time | Thumbnail | Dimensions | User | Comment | |
|---|---|---|---|---|---|
| current | 08:30, 26 June 2018 | | 857 × 699 (144 KB) | Furfur (talk | contribs) | Kosmetik |
| 08:22, 26 June 2018 |  | 857 × 699 (144 KB) | Furfur (talk | contribs) | etwas sinnvollere Farbeinteilung | |
| 01:40, 25 June 2018 |  | 857 × 699 (142 KB) | Furfur (talk | contribs) | Fehlerkorrektur+kräftigere Farben | |
| 13:36, 24 June 2018 |  | 857 × 699 (142 KB) | Furfur (talk | contribs) | == {{int:filedesc}} == {{Information |Description={{User:Medium69/Traduction}} {{de|1=Bevölkerungsänderungen nach administrativen Einheiten in der Volksrepublik China 2000-2010 in Prozent. {{legend|#FFE4E3|≤ 0 %}} {{legend|#00FAD4|>9–0,5 %}} {{legend|#04EFB6|>0,5–1,0 %}} {{legend|#00E199|>1,0 %}} }} {{en|1=Population changes in percent according to administrative units in the People’s Republic of China between 2000 and 2010.}} |Source={{Derived from|PRC Population Density.svg}} data source: Y... |
You cannot overwrite this file.
File usage on Commons
There are no pages that use this file.
File usage on other wikis
The following other wikis use this file:
- Usage on de.wikipedia.org