File:Greenhouse gas by sector 2000 de.svg
Jump to navigation
Jump to search

Size of this PNG preview of this SVG file: 694 × 600 pixels. Other resolutions: 278 × 240 pixels | 555 × 480 pixels | 889 × 768 pixels | 1,185 × 1,024 pixels | 2,370 × 2,048 pixels | 700 × 605 pixels.
Original file (SVG file, nominally 700 × 605 pixels, file size: 42 KB)
Captions
Captions
Add a one-line explanation of what this file represents
| Description |
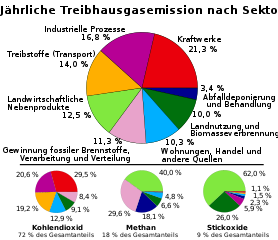
Deutsch: Diese Grafik zeigt die relativen Anteile der anthropogenen Treibhausgase aus 8 Kategorien wie sie von der Emission Database for Global Atmospheric Research version 3.2, fast track 2000 project abgeschätzt wurden. Diese Werte gebenen einen Überblick über das Jahr 2000. Die obere Grafik zeigt eine Summierung aller anthropogenen Treibhausgase, gewichtet nach ihrem Potential zur globalen Erwärmung in den nächsten 100 Jahren. Sie bestehen aus 72 % Kohlendioxid, 18 % Methan, 8 % Stickoxide und 1 % anderer Gase. Die unteren Figuren zeigen vergleichbare Inforationen für jedes dieser drei primären Treibhausgase. Die Farbgebung ist jeweils identisch. Segmente mit weniger als 1 % Anteil sind nicht gekennzeichnet. |
| Date | (UTC) |
| Source | |
| Author |
|
I, the copyright holder of this work, hereby publish it under the following licenses:
| This file is licensed under the Creative Commons Attribution-Share Alike 3.0 Unported license. | ||
| ||
| This licensing tag was added to this file as part of the GFDL licensing update. |

|
Permission is granted to copy, distribute and/or modify this document under the terms of the GNU Free Documentation License, Version 1.2 or any later version published by the Free Software Foundation; with no Invariant Sections, no Front-Cover Texts, and no Back-Cover Texts. A copy of the license is included in the section entitled GNU Free Documentation License. |
Image from Global Warming Art
This image is an original work created for Global Warming Art. Please refer to the image description page for more information.
|
|
Permission is granted to copy, distribute and/or modify this document under the terms of the GNU Free Documentation License, Version 1.2 or any later version published by the Free Software Foundation; with no Invariant Sections, no Front-Cover Texts, and no Back-Cover Texts. A copy of the license is included in the section entitled GNU Free Documentation License. |
| This file is licensed under the Creative Commons Attribution-Share Alike 3.0 Unported license. | ||
| ||
| This licensing tag was added to this file as part of the GFDL licensing update. |
You may select the license of your choice.
Original upload log[edit]
This image is a derivative work of the following images:
- File:Greenhouse_gas_by_sector_2000.svg licensed with Cc-by-sa-3.0-migrated, GFDL, GWArt
- 2010-03-28T10:22:18Z Setreset 650x603 (48019 Bytes) {{Information |Description={{en|1=This figure shows the relative fraction of man-made greenhouse gases coming from each of eight categories of sources, as estimated by the Emission Database for Global Atmospheric Research ver
Uploaded with derivativeFX
File history
Click on a date/time to view the file as it appeared at that time.
| Date/Time | Thumbnail | Dimensions | User | Comment | |
|---|---|---|---|---|---|
| current | 08:51, 11 August 2010 | | 700 × 605 (42 KB) | Cepheiden (talk | contribs) | Typo + Anpassungen, damit der wikirenderer auch alles anzeigt *hoff* |
| 22:20, 10 July 2010 |  | 650 × 603 (47 KB) | Matthias M. (talk | contribs) | {{Information |Description={{de|Diese Grafik zeigt die relativen Anteile der anthropogenen Treibhausgase aus 8 Kategorien wie sie von der Emission Database for Global Atmospheric Research version 3.2, fast track 2000 project abgeschätzt wurden. Diese Wer |
You cannot overwrite this file.
File usage on Commons
The following page uses this file:
File usage on other wikis
The following other wikis use this file:
- Usage on de.wikipedia.org